Cape Verdean vs Immigrants from Scotland Master's Degree
COMPARE
Cape Verdean
Immigrants from Scotland
Master's Degree
Master's Degree Comparison
Cape Verdeans
Immigrants from Scotland
12.1%
MASTER'S DEGREE
0.3/ 100
METRIC RATING
274th/ 347
METRIC RANK
17.4%
MASTER'S DEGREE
99.4/ 100
METRIC RATING
84th/ 347
METRIC RANK
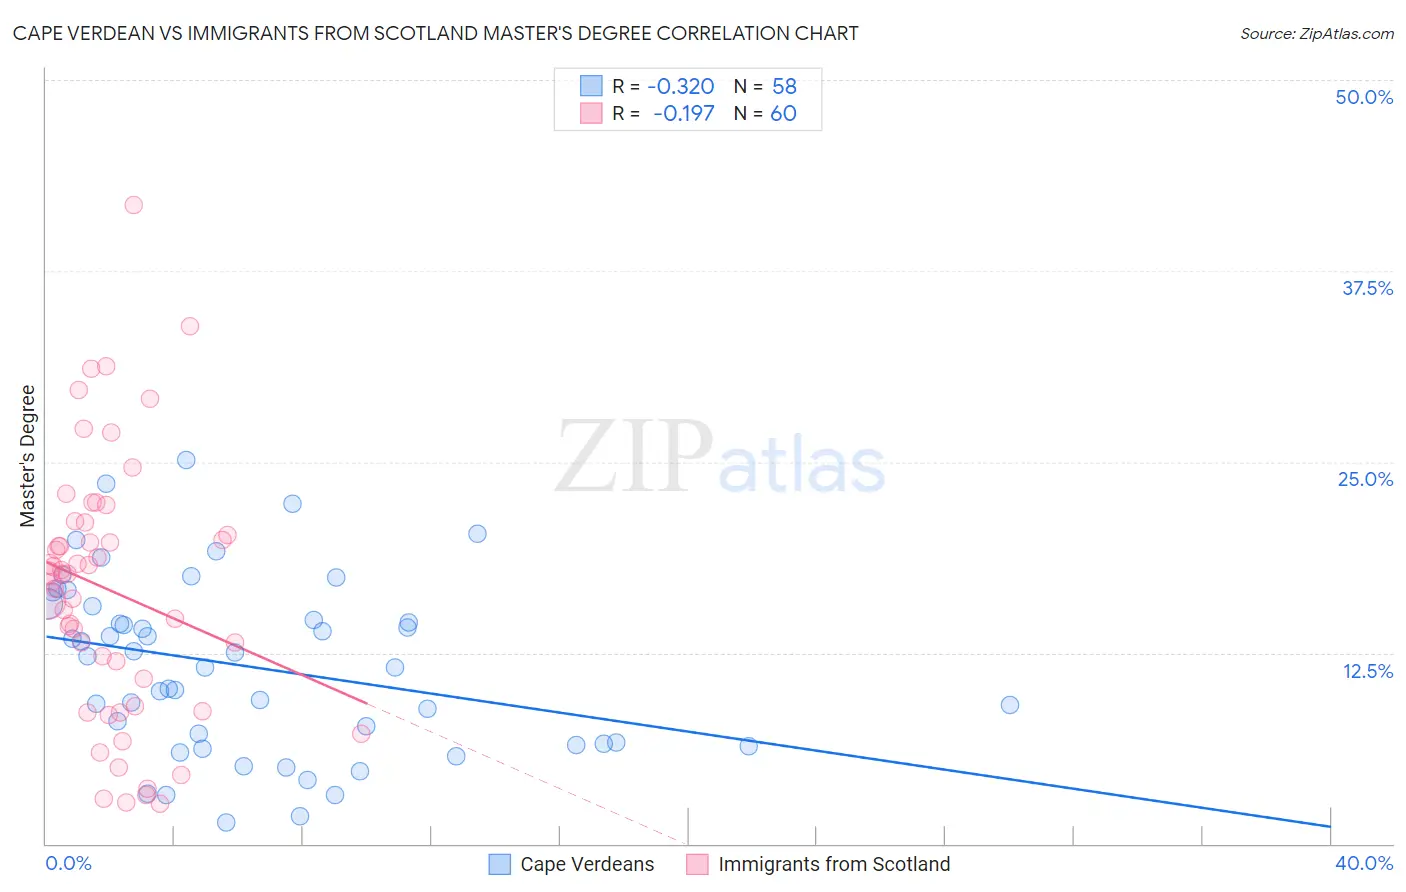
Cape Verdean vs Immigrants from Scotland Master's Degree Correlation Chart
The statistical analysis conducted on geographies consisting of 107,570,267 people shows a mild negative correlation between the proportion of Cape Verdeans and percentage of population with at least master's degree education in the United States with a correlation coefficient (R) of -0.320 and weighted average of 12.1%. Similarly, the statistical analysis conducted on geographies consisting of 196,383,554 people shows a poor negative correlation between the proportion of Immigrants from Scotland and percentage of population with at least master's degree education in the United States with a correlation coefficient (R) of -0.197 and weighted average of 17.4%, a difference of 43.9%.
Master's Degree Correlation Summary
| Measurement | Cape Verdean | Immigrants from Scotland |
| Minimum | 1.4% | 2.6% |
| Maximum | 25.1% | 41.8% |
| Range | 23.8% | 39.2% |
| Mean | 11.6% | 16.6% |
| Median | 11.9% | 17.7% |
| Interquartile 25% (IQ1) | 6.6% | 9.9% |
| Interquartile 75% (IQ3) | 15.6% | 20.6% |
| Interquartile Range (IQR) | 9.0% | 10.7% |
| Standard Deviation (Sample) | 5.7% | 8.4% |
| Standard Deviation (Population) | 5.7% | 8.3% |
Similar Demographics by Master's Degree
Demographics Similar to Cape Verdeans by Master's Degree
In terms of master's degree, the demographic groups most similar to Cape Verdeans are Cuban (12.1%, a difference of 0.020%), Black/African American (12.1%, a difference of 0.070%), Immigrants from Caribbean (12.1%, a difference of 0.080%), Potawatomi (12.1%, a difference of 0.080%), and Blackfeet (12.1%, a difference of 0.090%).
| Demographics | Rating | Rank | Master's Degree |
| Americans | 0.4 /100 | #267 | Tragic 12.3% |
| Native Hawaiians | 0.4 /100 | #268 | Tragic 12.3% |
| Central Americans | 0.3 /100 | #269 | Tragic 12.2% |
| Salvadorans | 0.3 /100 | #270 | Tragic 12.2% |
| Haitians | 0.3 /100 | #271 | Tragic 12.1% |
| Comanche | 0.3 /100 | #272 | Tragic 12.1% |
| Blackfeet | 0.3 /100 | #273 | Tragic 12.1% |
| Cape Verdeans | 0.3 /100 | #274 | Tragic 12.1% |
| Cubans | 0.3 /100 | #275 | Tragic 12.1% |
| Blacks/African Americans | 0.3 /100 | #276 | Tragic 12.1% |
| Immigrants | Caribbean | 0.3 /100 | #277 | Tragic 12.1% |
| Potawatomi | 0.3 /100 | #278 | Tragic 12.1% |
| Immigrants | Belize | 0.2 /100 | #279 | Tragic 12.1% |
| Immigrants | Dominican Republic | 0.2 /100 | #280 | Tragic 12.1% |
| Malaysians | 0.2 /100 | #281 | Tragic 12.0% |
Demographics Similar to Immigrants from Scotland by Master's Degree
In terms of master's degree, the demographic groups most similar to Immigrants from Scotland are Immigrants from Brazil (17.4%, a difference of 0.18%), Immigrants from Zimbabwe (17.4%, a difference of 0.33%), Greek (17.5%, a difference of 0.39%), Immigrants from Western Asia (17.5%, a difference of 0.44%), and Immigrants from Croatia (17.3%, a difference of 0.59%).
| Demographics | Rating | Rank | Master's Degree |
| Immigrants | Eastern Europe | 99.6 /100 | #77 | Exceptional 17.6% |
| Immigrants | Hungary | 99.6 /100 | #78 | Exceptional 17.5% |
| Immigrants | Lebanon | 99.6 /100 | #79 | Exceptional 17.5% |
| Carpatho Rusyns | 99.6 /100 | #80 | Exceptional 17.5% |
| Immigrants | Western Asia | 99.5 /100 | #81 | Exceptional 17.5% |
| Greeks | 99.5 /100 | #82 | Exceptional 17.5% |
| Immigrants | Zimbabwe | 99.5 /100 | #83 | Exceptional 17.4% |
| Immigrants | Scotland | 99.4 /100 | #84 | Exceptional 17.4% |
| Immigrants | Brazil | 99.4 /100 | #85 | Exceptional 17.4% |
| Immigrants | Croatia | 99.3 /100 | #86 | Exceptional 17.3% |
| Maltese | 99.3 /100 | #87 | Exceptional 17.3% |
| Immigrants | Canada | 99.2 /100 | #88 | Exceptional 17.2% |
| Bhutanese | 99.1 /100 | #89 | Exceptional 17.2% |
| Immigrants | Egypt | 99.1 /100 | #90 | Exceptional 17.2% |
| Romanians | 99.1 /100 | #91 | Exceptional 17.2% |