South African vs Ethiopian Professional Degree
COMPARE
South African
Ethiopian
Professional Degree
Professional Degree Comparison
South Africans
Ethiopians
5.7%
PROFESSIONAL DEGREE
100.0/ 100
METRIC RATING
57th/ 347
METRIC RANK
5.4%
PROFESSIONAL DEGREE
99.7/ 100
METRIC RATING
74th/ 347
METRIC RANK
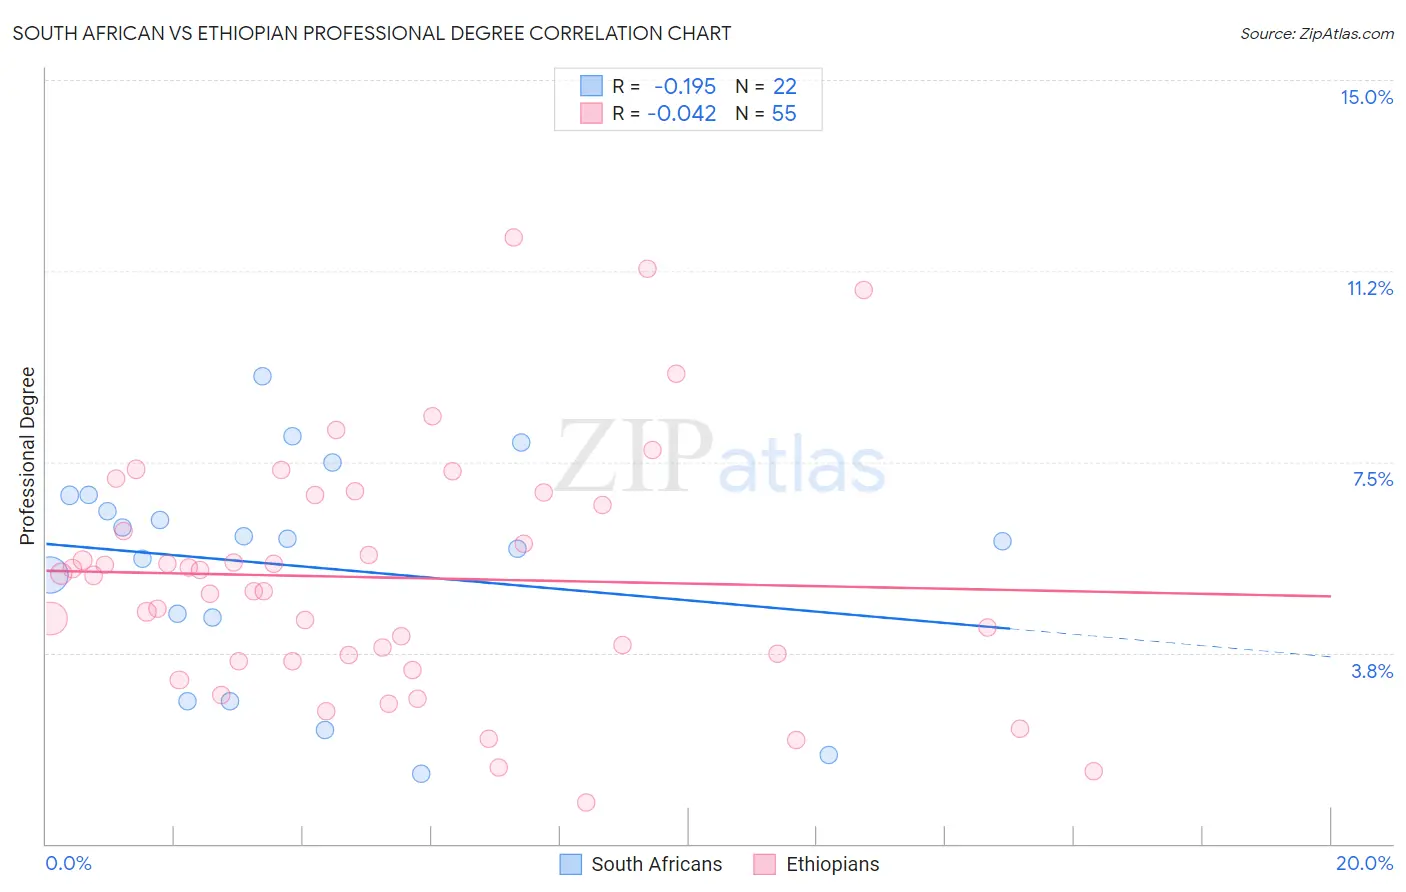
South African vs Ethiopian Professional Degree Correlation Chart
The statistical analysis conducted on geographies consisting of 182,499,194 people shows a poor negative correlation between the proportion of South Africans and percentage of population with at least professional degree education in the United States with a correlation coefficient (R) of -0.195 and weighted average of 5.7%. Similarly, the statistical analysis conducted on geographies consisting of 222,947,151 people shows no correlation between the proportion of Ethiopians and percentage of population with at least professional degree education in the United States with a correlation coefficient (R) of -0.042 and weighted average of 5.4%, a difference of 6.4%.
Professional Degree Correlation Summary
| Measurement | South African | Ethiopian |
| Minimum | 1.4% | 0.81% |
| Maximum | 9.2% | 11.9% |
| Range | 7.8% | 11.1% |
| Mean | 5.5% | 5.2% |
| Median | 6.0% | 5.3% |
| Interquartile 25% (IQ1) | 4.5% | 3.6% |
| Interquartile 75% (IQ3) | 6.8% | 6.8% |
| Interquartile Range (IQR) | 2.4% | 3.3% |
| Standard Deviation (Sample) | 2.1% | 2.4% |
| Standard Deviation (Population) | 2.1% | 2.4% |
Demographics Similar to South Africans and Ethiopians by Professional Degree
In terms of professional degree, the demographic groups most similar to South Africans are Immigrants from Malaysia (5.7%, a difference of 0.26%), Immigrants from Western Europe (5.7%, a difference of 0.38%), Bulgarian (5.7%, a difference of 0.59%), Immigrants from Europe (5.6%, a difference of 1.1%), and Bolivian (5.6%, a difference of 1.5%). Similarly, the demographic groups most similar to Ethiopians are Immigrants from Indonesia (5.3%, a difference of 0.13%), Immigrants from Romania (5.4%, a difference of 0.38%), Lithuanian (5.4%, a difference of 0.47%), Immigrants from Western Asia (5.4%, a difference of 0.96%), and Bhutanese (5.4%, a difference of 1.5%).
| Demographics | Rating | Rank | Professional Degree |
| Immigrants | Western Europe | 100.0 /100 | #55 | Exceptional 5.7% |
| Immigrants | Malaysia | 100.0 /100 | #56 | Exceptional 5.7% |
| South Africans | 100.0 /100 | #57 | Exceptional 5.7% |
| Bulgarians | 100.0 /100 | #58 | Exceptional 5.7% |
| Immigrants | Europe | 100.0 /100 | #59 | Exceptional 5.6% |
| Bolivians | 99.9 /100 | #60 | Exceptional 5.6% |
| Immigrants | Lithuania | 99.9 /100 | #61 | Exceptional 5.6% |
| Immigrants | Belarus | 99.9 /100 | #62 | Exceptional 5.5% |
| Asians | 99.9 /100 | #63 | Exceptional 5.5% |
| Immigrants | Asia | 99.9 /100 | #64 | Exceptional 5.5% |
| Immigrants | Bolivia | 99.9 /100 | #65 | Exceptional 5.5% |
| Immigrants | Kazakhstan | 99.9 /100 | #66 | Exceptional 5.5% |
| Immigrants | Bulgaria | 99.9 /100 | #67 | Exceptional 5.5% |
| Immigrants | Lebanon | 99.9 /100 | #68 | Exceptional 5.5% |
| Immigrants | Hungary | 99.9 /100 | #69 | Exceptional 5.5% |
| Bhutanese | 99.8 /100 | #70 | Exceptional 5.4% |
| Immigrants | Western Asia | 99.8 /100 | #71 | Exceptional 5.4% |
| Lithuanians | 99.8 /100 | #72 | Exceptional 5.4% |
| Immigrants | Romania | 99.8 /100 | #73 | Exceptional 5.4% |
| Ethiopians | 99.7 /100 | #74 | Exceptional 5.4% |
| Immigrants | Indonesia | 99.7 /100 | #75 | Exceptional 5.3% |