Japanese vs Ghanaian 11th Grade

COMPARE

Japanese
Race
Ancestry
AfghanAfricanAlaska NativeAlaskan AthabascanAlbanianAleutAlsatianAmericanApacheArabArapahoArgentineanArmenianAssyrian/Chaldean/SyriacAustralianAustrianBahamianBangladeshiBarbadianBasqueBelgianBelizeanBermudanBhutaneseBlackfeetBolivianBrazilianBritishBritish West IndianBulgarianBurmeseCajunCambodianCanadianCape VerdeanCarpatho RusynCelticCentral AmericanCentral American IndianCherokeeCheyenneChickasawChileanChineseChippewaChoctawColombianColvilleComancheCosta RicanCreeCreekCroatianCrowCubanCypriotCzechCzechoslovakianDanishDelawareDominicanDutchDutch West IndianEastern EuropeanEcuadorianEgyptianEnglishEstonianEthiopianEuropeanFijianFilipinoFinnishFrenchFrench American IndianFrench CanadianGermanGerman RussianGreekGuamanian/ChamorroGuatemalanGuyaneseHaitianHmongHonduranHopiHoumaHungarianIcelanderIndian (Asian)IndonesianInupiatIranianIraqiIrishIroquoisIsraeliItalianJamaicanJapaneseJordanianKenyanKiowaKoreanLaotianLatvianLebaneseLiberianLithuanianLumbeeLuxembourgerMacedonianMalaysianMalteseMarshalleseMenomineeMexicanMexican American IndianMongolianMoroccanNative HawaiianNavajoNepaleseNew ZealanderNicaraguanNigerianNorthern EuropeanNorwegianOkinawanOsageOttawaPaiutePakistaniPalestinianPanamanianParaguayanPennsylvania GermanPeruvianPimaPolishPortuguesePotawatomiPuebloPuerto RicanPuget Sound SalishRomanianRussianSalvadoranSamoanScandinavianScotch-IrishScottishSeminoleSenegaleseSerbianShoshoneSierra LeoneanSiouxSlavicSlovakSloveneSomaliSouth AfricanSouth AmericanSouth American IndianSoviet UnionSpaniardSpanishSpanish AmericanSpanish American IndianSri LankanSubsaharan AfricanSudaneseSwedishSwissSyrianTaiwaneseThaiTlingit-HaidaTohono O'OdhamTonganTrinidadian and TobagonianTsimshianTurkishU.S. Virgin IslanderUgandanUkrainianUruguayanUteVenezuelanVietnameseWelshWest IndianYakamaYaquiYugoslavianYumanYup'ikZimbabwean
Immigration
NonimmigrantsImmigrantsAfghanistanAfricaAlbaniaArgentinaArmeniaAsiaAustraliaAustriaBahamasBangladeshBarbadosBelarusBelgiumBelizeBoliviaBosnia and HerzegovinaBrazilBulgariaBurma/MyanmarCabo VerdeCambodiaCameroonCanadaCaribbeanCentral AmericaChileChinaColombiaCongoCosta RicaCroatiaCubaCzechoslovakiaDenmarkDominicaDominican RepublicEastern AfricaEastern AsiaEastern EuropeEcuadorEgyptEl SalvadorEnglandEritreaEthiopiaEuropeFijiFranceGermanyGhanaGreeceGrenadaGuatemalaGuyanaHaitiHondurasHong KongHungaryIndiaIndonesiaIranIraqIrelandIsraelItalyJamaicaJapanJordanKazakhstanKenyaKoreaKuwaitLaosLatin AmericaLatviaLebanonLiberiaLithuaniaMalaysiaMexicoMicronesiaMiddle AfricaMoldovaMoroccoNepalNetherlandsNicaraguaNigeriaNorth AmericaNorth MacedoniaNorthern AfricaNorthern EuropeNorwayOceaniaPakistanPanamaPeruPhilippinesPolandPortugalRomaniaRussiaSaudi ArabiaScotlandSenegalSerbiaSierra LeoneSingaporeSomaliaSouth AfricaSouth AmericaSouth Central AsiaSouth Eastern AsiaSouthern EuropeSpainSri LankaSt. Vincent and the GrenadinesSudanSwedenSwitzerlandSyriaTaiwanThailandTrinidad and TobagoTurkeyUgandaUkraineUruguayUzbekistanVenezuelaVietnamWest IndiesWestern AfricaWestern AsiaWestern EuropeYemenZaireZimbabweAzores
Ghanaian
Race
Ancestry
AfghanAfricanAlaska NativeAlaskan AthabascanAlbanianAleutAlsatianAmericanApacheArabArapahoArgentineanArmenianAssyrian/Chaldean/SyriacAustralianAustrianBahamianBangladeshiBarbadianBasqueBelgianBelizeanBermudanBhutaneseBlackfeetBolivianBrazilianBritishBritish West IndianBulgarianBurmeseCajunCambodianCanadianCape VerdeanCarpatho RusynCelticCentral AmericanCentral American IndianCherokeeCheyenneChickasawChileanChineseChippewaChoctawColombianColvilleComancheCosta RicanCreeCreekCroatianCrowCubanCypriotCzechCzechoslovakianDanishDelawareDominicanDutchDutch West IndianEastern EuropeanEcuadorianEgyptianEnglishEstonianEthiopianEuropeanFijianFilipinoFinnishFrenchFrench American IndianFrench CanadianGermanGerman RussianGhanaianGreekGuamanian/ChamorroGuatemalanGuyaneseHaitianHmongHonduranHopiHoumaHungarianIcelanderIndian (Asian)IndonesianInupiatIranianIraqiIrishIroquoisIsraeliItalianJamaicanJordanianKenyanKiowaKoreanLaotianLatvianLebaneseLiberianLithuanianLumbeeLuxembourgerMacedonianMalaysianMalteseMarshalleseMenomineeMexicanMexican American IndianMongolianMoroccanNative HawaiianNavajoNepaleseNew ZealanderNicaraguanNigerianNorthern EuropeanNorwegianOkinawanOsageOttawaPaiutePakistaniPalestinianPanamanianParaguayanPennsylvania GermanPeruvianPimaPolishPortuguesePotawatomiPuebloPuerto RicanPuget Sound SalishRomanianRussianSalvadoranSamoanScandinavianScotch-IrishScottishSeminoleSenegaleseSerbianShoshoneSierra LeoneanSiouxSlavicSlovakSloveneSomaliSouth AfricanSouth AmericanSouth American IndianSoviet UnionSpaniardSpanishSpanish AmericanSpanish American IndianSri LankanSubsaharan AfricanSudaneseSwedishSwissSyrianTaiwaneseThaiTlingit-HaidaTohono O'OdhamTonganTrinidadian and TobagonianTsimshianTurkishU.S. Virgin IslanderUgandanUkrainianUruguayanUteVenezuelanVietnameseWelshWest IndianYakamaYaquiYugoslavianYumanYup'ikZimbabwean
Immigration
NonimmigrantsImmigrantsAfghanistanAfricaAlbaniaArgentinaArmeniaAsiaAustraliaAustriaBahamasBangladeshBarbadosBelarusBelgiumBelizeBoliviaBosnia and HerzegovinaBrazilBulgariaBurma/MyanmarCabo VerdeCambodiaCameroonCanadaCaribbeanCentral AmericaChileChinaColombiaCongoCosta RicaCroatiaCubaCzechoslovakiaDenmarkDominicaDominican RepublicEastern AfricaEastern AsiaEastern EuropeEcuadorEgyptEl SalvadorEnglandEritreaEthiopiaEuropeFijiFranceGermanyGhanaGreeceGrenadaGuatemalaGuyanaHaitiHondurasHong KongHungaryIndiaIndonesiaIranIraqIrelandIsraelItalyJamaicaJapanJordanKazakhstanKenyaKoreaKuwaitLaosLatin AmericaLatviaLebanonLiberiaLithuaniaMalaysiaMexicoMicronesiaMiddle AfricaMoldovaMoroccoNepalNetherlandsNicaraguaNigeriaNorth AmericaNorth MacedoniaNorthern AfricaNorthern EuropeNorwayOceaniaPakistanPanamaPeruPhilippinesPolandPortugalRomaniaRussiaSaudi ArabiaScotlandSenegalSerbiaSierra LeoneSingaporeSomaliaSouth AfricaSouth AmericaSouth Central AsiaSouth Eastern AsiaSouthern EuropeSpainSri LankaSt. Vincent and the GrenadinesSudanSwedenSwitzerlandSyriaTaiwanThailandTrinidad and TobagoTurkeyUgandaUkraineUruguayUzbekistanVenezuelaVietnamWest IndiesWestern AfricaWestern AsiaWestern EuropeYemenZaireZimbabweAzores
11th Grade
Income
Poverty
Unemployment
Labor Participation
Family Structure
Vehicle Availability
Education Level
Disability

11th Grade Comparison

Japanese

Ghanaians

Tragic
Tragic
89.9%
11TH GRADE
0.0/ 100
METRIC RATING
299th/ 347
METRIC RANK
91.5%
11TH GRADE
0.9/ 100
METRIC RATING
250th/ 347
METRIC RANK

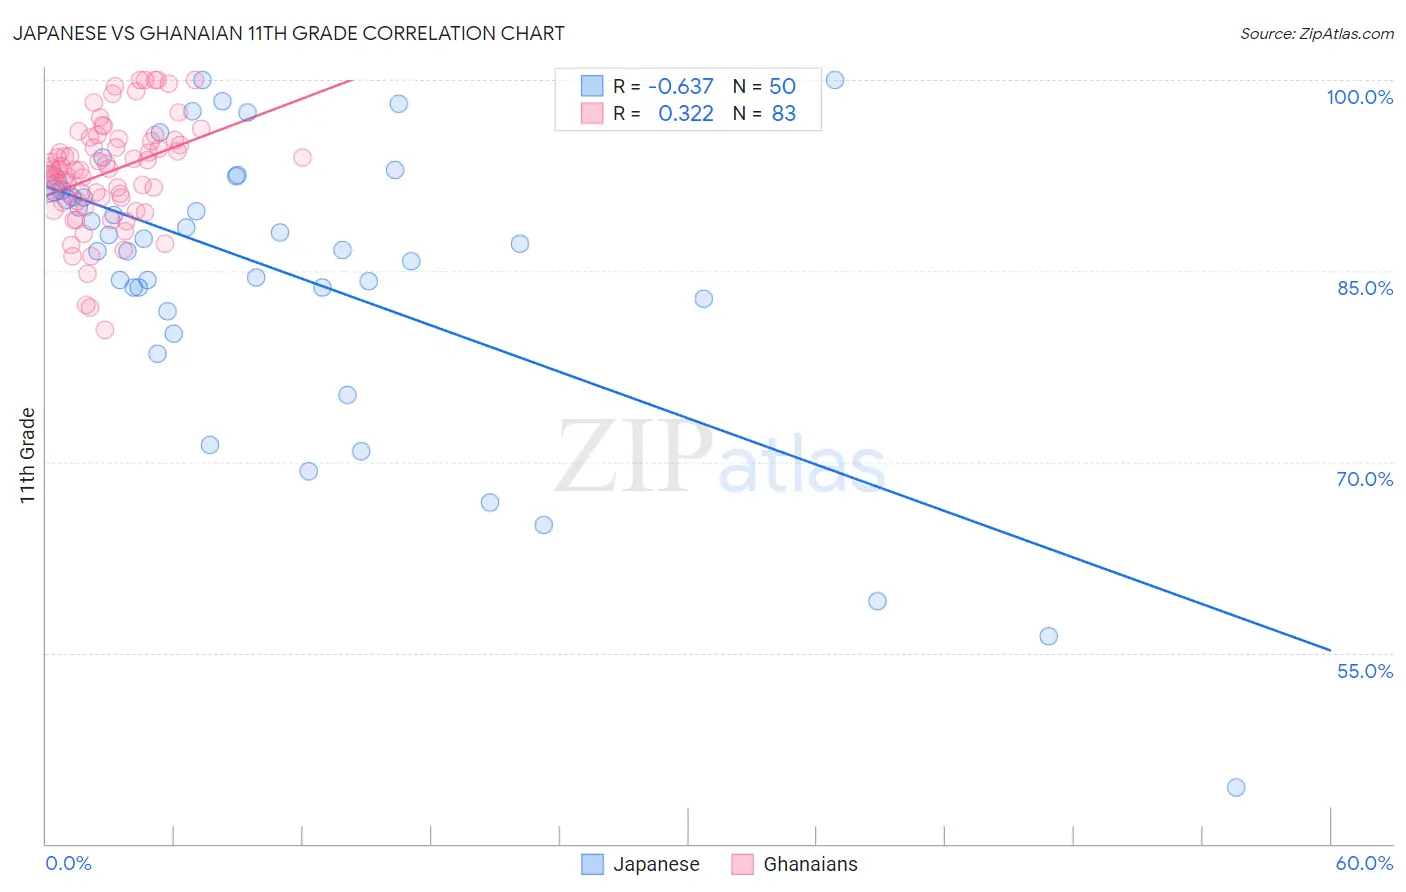
Japanese vs Ghanaian 11th Grade Correlation Chart

The statistical analysis conducted on geographies consisting of 249,183,224 people shows a significant negative correlation between the proportion of Japanese and percentage of population with at least 11th grade education in the United States with a correlation coefficient (R) of -0.637 and weighted average of 89.9%. Similarly, the statistical analysis conducted on geographies consisting of 190,714,079 people shows a mild positive correlation between the proportion of Ghanaians and percentage of population with at least 11th grade education in the United States with a correlation coefficient (R) of 0.322 and weighted average of 91.5%, a difference of 1.7%.
Japanese vs Ghanaian 11th Grade

11th Grade Correlation Summary

MeasurementJapaneseGhanaian
Minimum44.4%80.3%
Maximum100.0%100.0%
Range55.6%19.7%
Mean84.8%92.7%
Median87.3%93.0%
Interquartile 25% (IQ1)82.8%90.4%
Interquartile 75% (IQ3)91.4%95.3%
Interquartile Range (IQR)8.6%4.9%
Standard Deviation (Sample)11.5%4.2%
Standard Deviation (Population)11.4%4.2%

Similar Demographics by 11th Grade

Demographics Similar to Japanese by 11th Grade

In terms of 11th grade, the demographic groups most similar to Japanese are Immigrants from Haiti (89.9%, a difference of 0.010%), Guyanese (89.9%, a difference of 0.020%), Immigrants from Fiji (89.9%, a difference of 0.030%), Navajo (90.0%, a difference of 0.10%), and Fijian (90.0%, a difference of 0.14%).
DemographicsRating | Rank11th Grade
Cubans
0.0
/100
|
#292
Tragic
90.2%
Natives/Alaskans
0.0
/100
|
#293
Tragic
90.2%
Immigrants | Grenada
0.0
/100
|
#294
Tragic
90.1%
Immigrants | Vietnam
0.0
/100
|
#295
Tragic
90.0%
Fijians
0.0
/100
|
#296
Tragic
90.0%
Navajo
0.0
/100
|
#297
Tragic
90.0%
Immigrants | Fiji
0.0
/100
|
#298
Tragic
89.9%
Japanese
0.0
/100
|
#299
Tragic
89.9%
Immigrants | Haiti
0.0
/100
|
#300
Tragic
89.9%
Guyanese
0.0
/100
|
#301
Tragic
89.9%
Immigrants | Guyana
0.0
/100
|
#302
Tragic
89.7%
Immigrants | Immigrants
0.0
/100
|
#303
Tragic
89.7%
Yuman
0.0
/100
|
#304
Tragic
89.7%
Immigrants | Cambodia
0.0
/100
|
#305
Tragic
89.6%
Ecuadorians
0.0
/100
|
#306
Tragic
89.6%

Demographics Similar to Ghanaians by 11th Grade

In terms of 11th grade, the demographic groups most similar to Ghanaians are Peruvian (91.5%, a difference of 0.0%), Immigrants from Philippines (91.5%, a difference of 0.010%), Immigrants from Uzbekistan (91.5%, a difference of 0.010%), Immigrants from Costa Rica (91.4%, a difference of 0.020%), and Immigrants from Nigeria (91.4%, a difference of 0.030%).
DemographicsRating | Rank11th Grade
Immigrants | Thailand
1.4
/100
|
#243
Tragic
91.6%
Senegalese
1.4
/100
|
#244
Tragic
91.6%
Africans
1.3
/100
|
#245
Tragic
91.5%
Seminole
1.2
/100
|
#246
Tragic
91.5%
Immigrants | Philippines
1.0
/100
|
#247
Tragic
91.5%
Immigrants | Uzbekistan
1.0
/100
|
#248
Tragic
91.5%
Peruvians
1.0
/100
|
#249
Tragic
91.5%
Ghanaians
0.9
/100
|
#250
Tragic
91.5%
Immigrants | Costa Rica
0.9
/100
|
#251
Tragic
91.4%
Immigrants | Nigeria
0.8
/100
|
#252
Tragic
91.4%
Immigrants | South America
0.8
/100
|
#253
Tragic
91.4%
Immigrants | Eritrea
0.7
/100
|
#254
Tragic
91.4%
Blacks/African Americans
0.7
/100
|
#255
Tragic
91.4%
Immigrants | Senegal
0.7
/100
|
#256
Tragic
91.4%
Cajuns
0.7
/100
|
#257
Tragic
91.4%