Immigrants from Barbados vs Portuguese Professional Degree

COMPARE

Immigrants from Barbados
Race
Ancestry
AfghanAfricanAlaska NativeAlaskan AthabascanAlbanianAleutAlsatianAmericanApacheArabArapahoArgentineanArmenianAssyrian/Chaldean/SyriacAustralianAustrianBahamianBangladeshiBarbadianBasqueBelgianBelizeanBermudanBhutaneseBlackfeetBolivianBrazilianBritishBritish West IndianBulgarianBurmeseCajunCambodianCanadianCape VerdeanCarpatho RusynCelticCentral AmericanCentral American IndianCherokeeCheyenneChickasawChileanChineseChippewaChoctawColombianColvilleComancheCosta RicanCreeCreekCroatianCrowCubanCypriotCzechCzechoslovakianDanishDelawareDominicanDutchDutch West IndianEastern EuropeanEcuadorianEgyptianEnglishEstonianEthiopianEuropeanFijianFilipinoFinnishFrenchFrench American IndianFrench CanadianGermanGerman RussianGhanaianGreekGuamanian/ChamorroGuatemalanGuyaneseHaitianHmongHonduranHopiHoumaHungarianIcelanderIndian (Asian)IndonesianInupiatIranianIraqiIrishIroquoisIsraeliItalianJamaicanJapaneseJordanianKenyanKiowaKoreanLaotianLatvianLebaneseLiberianLithuanianLumbeeLuxembourgerMacedonianMalaysianMalteseMarshalleseMenomineeMexicanMexican American IndianMongolianMoroccanNative HawaiianNavajoNepaleseNew ZealanderNicaraguanNigerianNorthern EuropeanNorwegianOkinawanOsageOttawaPaiutePakistaniPalestinianPanamanianParaguayanPennsylvania GermanPeruvianPimaPolishPotawatomiPuebloPuerto RicanPuget Sound SalishRomanianRussianSalvadoranSamoanScandinavianScotch-IrishScottishSeminoleSenegaleseSerbianShoshoneSierra LeoneanSiouxSlavicSlovakSloveneSomaliSouth AfricanSouth AmericanSouth American IndianSoviet UnionSpaniardSpanishSpanish AmericanSpanish American IndianSri LankanSubsaharan AfricanSudaneseSwedishSwissSyrianTaiwaneseThaiTlingit-HaidaTohono O'OdhamTonganTrinidadian and TobagonianTsimshianTurkishU.S. Virgin IslanderUgandanUkrainianUruguayanUteVenezuelanVietnameseWelshWest IndianYakamaYaquiYugoslavianYumanYup'ikZimbabwean
Immigration
NonimmigrantsImmigrantsAfghanistanAfricaAlbaniaArgentinaArmeniaAsiaAustraliaAustriaBahamasBangladeshBarbadosBelarusBelgiumBelizeBoliviaBosnia and HerzegovinaBrazilBulgariaBurma/MyanmarCabo VerdeCambodiaCameroonCanadaCaribbeanCentral AmericaChileChinaColombiaCongoCosta RicaCroatiaCubaCzechoslovakiaDenmarkDominicaDominican RepublicEastern AfricaEastern AsiaEastern EuropeEcuadorEgyptEl SalvadorEnglandEritreaEthiopiaEuropeFijiFranceGermanyGhanaGreeceGrenadaGuatemalaGuyanaHaitiHondurasHong KongHungaryIndiaIndonesiaIranIraqIrelandIsraelItalyJamaicaJapanJordanKazakhstanKenyaKoreaKuwaitLaosLatin AmericaLatviaLebanonLiberiaLithuaniaMalaysiaMexicoMicronesiaMiddle AfricaMoldovaMoroccoNepalNetherlandsNicaraguaNigeriaNorth AmericaNorth MacedoniaNorthern AfricaNorthern EuropeNorwayOceaniaPakistanPanamaPeruPhilippinesPolandPortugalRomaniaRussiaSaudi ArabiaScotlandSenegalSerbiaSierra LeoneSingaporeSomaliaSouth AfricaSouth AmericaSouth Central AsiaSouth Eastern AsiaSouthern EuropeSpainSri LankaSt. Vincent and the GrenadinesSudanSwedenSwitzerlandSyriaTaiwanThailandTrinidad and TobagoTurkeyUgandaUkraineUruguayUzbekistanVenezuelaVietnamWest IndiesWestern AfricaWestern AsiaWestern EuropeYemenZaireZimbabweAzores
Portuguese
Race
Ancestry
AfghanAfricanAlaska NativeAlaskan AthabascanAlbanianAleutAlsatianAmericanApacheArabArapahoArgentineanArmenianAssyrian/Chaldean/SyriacAustralianAustrianBahamianBangladeshiBarbadianBasqueBelgianBelizeanBermudanBhutaneseBlackfeetBolivianBrazilianBritishBritish West IndianBulgarianBurmeseCajunCambodianCanadianCape VerdeanCarpatho RusynCelticCentral AmericanCentral American IndianCherokeeCheyenneChickasawChileanChineseChippewaChoctawColombianColvilleComancheCosta RicanCreeCreekCroatianCrowCubanCypriotCzechCzechoslovakianDanishDelawareDominicanDutchDutch West IndianEastern EuropeanEcuadorianEgyptianEnglishEstonianEthiopianEuropeanFijianFilipinoFinnishFrenchFrench American IndianFrench CanadianGermanGerman RussianGhanaianGreekGuamanian/ChamorroGuatemalanGuyaneseHaitianHmongHonduranHopiHoumaHungarianIcelanderIndian (Asian)IndonesianInupiatIranianIraqiIrishIroquoisIsraeliItalianJamaicanJapaneseJordanianKenyanKiowaKoreanLaotianLatvianLebaneseLiberianLithuanianLumbeeLuxembourgerMacedonianMalaysianMalteseMarshalleseMenomineeMexicanMexican American IndianMongolianMoroccanNative HawaiianNavajoNepaleseNew ZealanderNicaraguanNigerianNorthern EuropeanNorwegianOkinawanOsageOttawaPaiutePakistaniPalestinianPanamanianParaguayanPennsylvania GermanPeruvianPimaPolishPortuguesePotawatomiPuebloPuerto RicanPuget Sound SalishRomanianRussianSalvadoranSamoanScandinavianScotch-IrishScottishSeminoleSenegaleseSerbianShoshoneSierra LeoneanSiouxSlavicSlovakSloveneSomaliSouth AfricanSouth AmericanSouth American IndianSoviet UnionSpaniardSpanishSpanish AmericanSpanish American IndianSri LankanSubsaharan AfricanSudaneseSwedishSwissSyrianTaiwaneseThaiTlingit-HaidaTohono O'OdhamTonganTrinidadian and TobagonianTsimshianTurkishU.S. Virgin IslanderUgandanUkrainianUruguayanUteVenezuelanVietnameseWelshWest IndianYakamaYaquiYugoslavianYumanYup'ikZimbabwean
Immigration
NonimmigrantsImmigrantsAfghanistanAfricaAlbaniaArgentinaArmeniaAsiaAustraliaAustriaBahamasBangladeshBelarusBelgiumBelizeBoliviaBosnia and HerzegovinaBrazilBulgariaBurma/MyanmarCabo VerdeCambodiaCameroonCanadaCaribbeanCentral AmericaChileChinaColombiaCongoCosta RicaCroatiaCubaCzechoslovakiaDenmarkDominicaDominican RepublicEastern AfricaEastern AsiaEastern EuropeEcuadorEgyptEl SalvadorEnglandEritreaEthiopiaEuropeFijiFranceGermanyGhanaGreeceGrenadaGuatemalaGuyanaHaitiHondurasHong KongHungaryIndiaIndonesiaIranIraqIrelandIsraelItalyJamaicaJapanJordanKazakhstanKenyaKoreaKuwaitLaosLatin AmericaLatviaLebanonLiberiaLithuaniaMalaysiaMexicoMicronesiaMiddle AfricaMoldovaMoroccoNepalNetherlandsNicaraguaNigeriaNorth AmericaNorth MacedoniaNorthern AfricaNorthern EuropeNorwayOceaniaPakistanPanamaPeruPhilippinesPolandPortugalRomaniaRussiaSaudi ArabiaScotlandSenegalSerbiaSierra LeoneSingaporeSomaliaSouth AfricaSouth AmericaSouth Central AsiaSouth Eastern AsiaSouthern EuropeSpainSri LankaSt. Vincent and the GrenadinesSudanSwedenSwitzerlandSyriaTaiwanThailandTrinidad and TobagoTurkeyUgandaUkraineUruguayUzbekistanVenezuelaVietnamWest IndiesWestern AfricaWestern AsiaWestern EuropeYemenZaireZimbabweAzores
Professional Degree
Income
Poverty
Unemployment
Labor Participation
Family Structure
Vehicle Availability
Education Level
Disability

Professional Degree Comparison

Immigrants from Barbados

Portuguese

Tragic
Poor
3.9%
PROFESSIONAL DEGREE
4.0/ 100
METRIC RATING
235th/ 347
METRIC RANK
4.1%
PROFESSIONAL DEGREE
10.5/ 100
METRIC RATING
215th/ 347
METRIC RANK

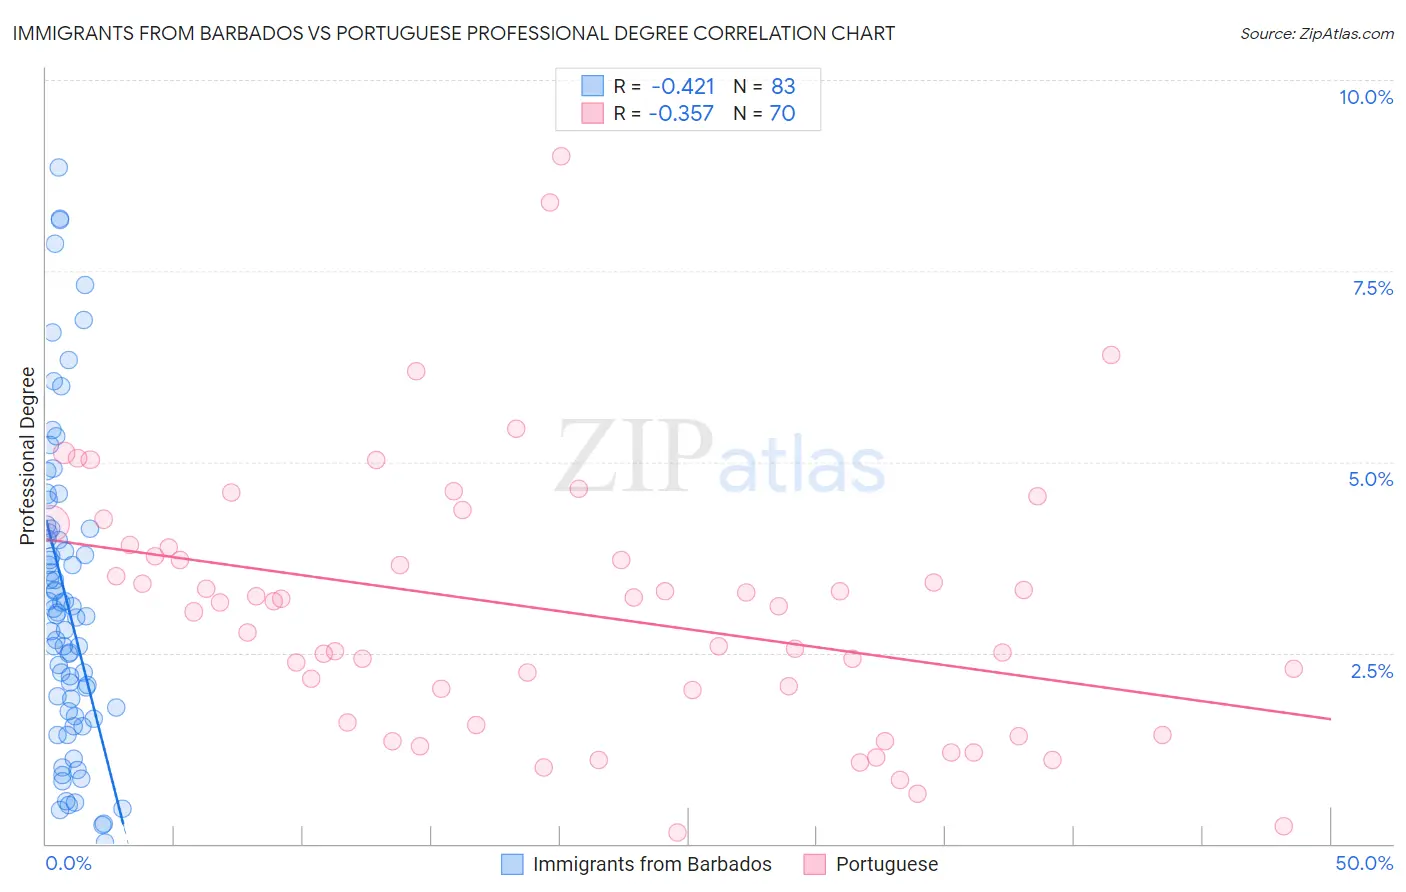
Immigrants from Barbados vs Portuguese Professional Degree Correlation Chart

The statistical analysis conducted on geographies consisting of 112,711,705 people shows a moderate negative correlation between the proportion of Immigrants from Barbados and percentage of population with at least professional degree education in the United States with a correlation coefficient (R) of -0.421 and weighted average of 3.9%. Similarly, the statistical analysis conducted on geographies consisting of 448,577,739 people shows a mild negative correlation between the proportion of Portuguese and percentage of population with at least professional degree education in the United States with a correlation coefficient (R) of -0.357 and weighted average of 4.1%, a difference of 4.2%.
Immigrants from Barbados vs Portuguese Professional Degree

Professional Degree Correlation Summary

MeasurementImmigrants from BarbadosPortuguese
Minimum0.017%0.14%
Maximum8.9%9.0%
Range8.8%8.9%
Mean3.2%3.1%
Median3.0%3.1%
Interquartile 25% (IQ1)1.7%1.6%
Interquartile 75% (IQ3)4.1%3.9%
Interquartile Range (IQR)2.4%2.3%
Standard Deviation (Sample)2.0%1.7%
Standard Deviation (Population)2.0%1.7%

Demographics Similar to Immigrants from Barbados and Portuguese by Professional Degree

In terms of professional degree, the demographic groups most similar to Immigrants from Barbados are Nonimmigrants (3.9%, a difference of 0.010%), Immigrants from Philippines (3.9%, a difference of 0.050%), Cree (3.9%, a difference of 0.31%), Ecuadorian (3.9%, a difference of 0.53%), and Nicaraguan (3.9%, a difference of 0.98%). Similarly, the demographic groups most similar to Portuguese are West Indian (4.1%, a difference of 0.31%), Immigrants from Vietnam (4.0%, a difference of 0.48%), Dutch (4.0%, a difference of 0.69%), Immigrants from South Eastern Asia (4.0%, a difference of 0.72%), and Ute (4.0%, a difference of 1.1%).
DemographicsRating | RankProfessional Degree
Portuguese
10.5
/100
|
#215
Poor
4.1%
West Indians
9.8
/100
|
#216
Tragic
4.1%
Immigrants | Vietnam
9.4
/100
|
#217
Tragic
4.0%
Dutch
9.0
/100
|
#218
Tragic
4.0%
Immigrants | South Eastern Asia
8.9
/100
|
#219
Tragic
4.0%
Ute
8.2
/100
|
#220
Tragic
4.0%
French Canadians
8.0
/100
|
#221
Tragic
4.0%
Immigrants | Western Africa
7.5
/100
|
#222
Tragic
4.0%
Immigrants | Bosnia and Herzegovina
7.4
/100
|
#223
Tragic
4.0%
Trinidadians and Tobagonians
7.1
/100
|
#224
Tragic
4.0%
Tlingit-Haida
6.9
/100
|
#225
Tragic
4.0%
German Russians
6.1
/100
|
#226
Tragic
4.0%
Cubans
5.9
/100
|
#227
Tragic
4.0%
Immigrants | West Indies
5.6
/100
|
#228
Tragic
4.0%
Immigrants | Burma/Myanmar
5.4
/100
|
#229
Tragic
3.9%
Nicaraguans
5.1
/100
|
#230
Tragic
3.9%
Ecuadorians
4.6
/100
|
#231
Tragic
3.9%
Cree
4.3
/100
|
#232
Tragic
3.9%
Immigrants | Philippines
4.1
/100
|
#233
Tragic
3.9%
Immigrants | Nonimmigrants
4.0
/100
|
#234
Tragic
3.9%
Immigrants | Barbados
4.0
/100
|
#235
Tragic
3.9%