Immigrants from Malaysia vs Immigrants from Spain 5th Grade
COMPARE
Immigrants from Malaysia
Immigrants from Spain
5th Grade
5th Grade Comparison
Immigrants from Malaysia
Immigrants from Spain
97.0%
5TH GRADE
4.1/ 100
METRIC RATING
231st/ 347
METRIC RANK
97.3%
5TH GRADE
47.0/ 100
METRIC RATING
177th/ 347
METRIC RANK
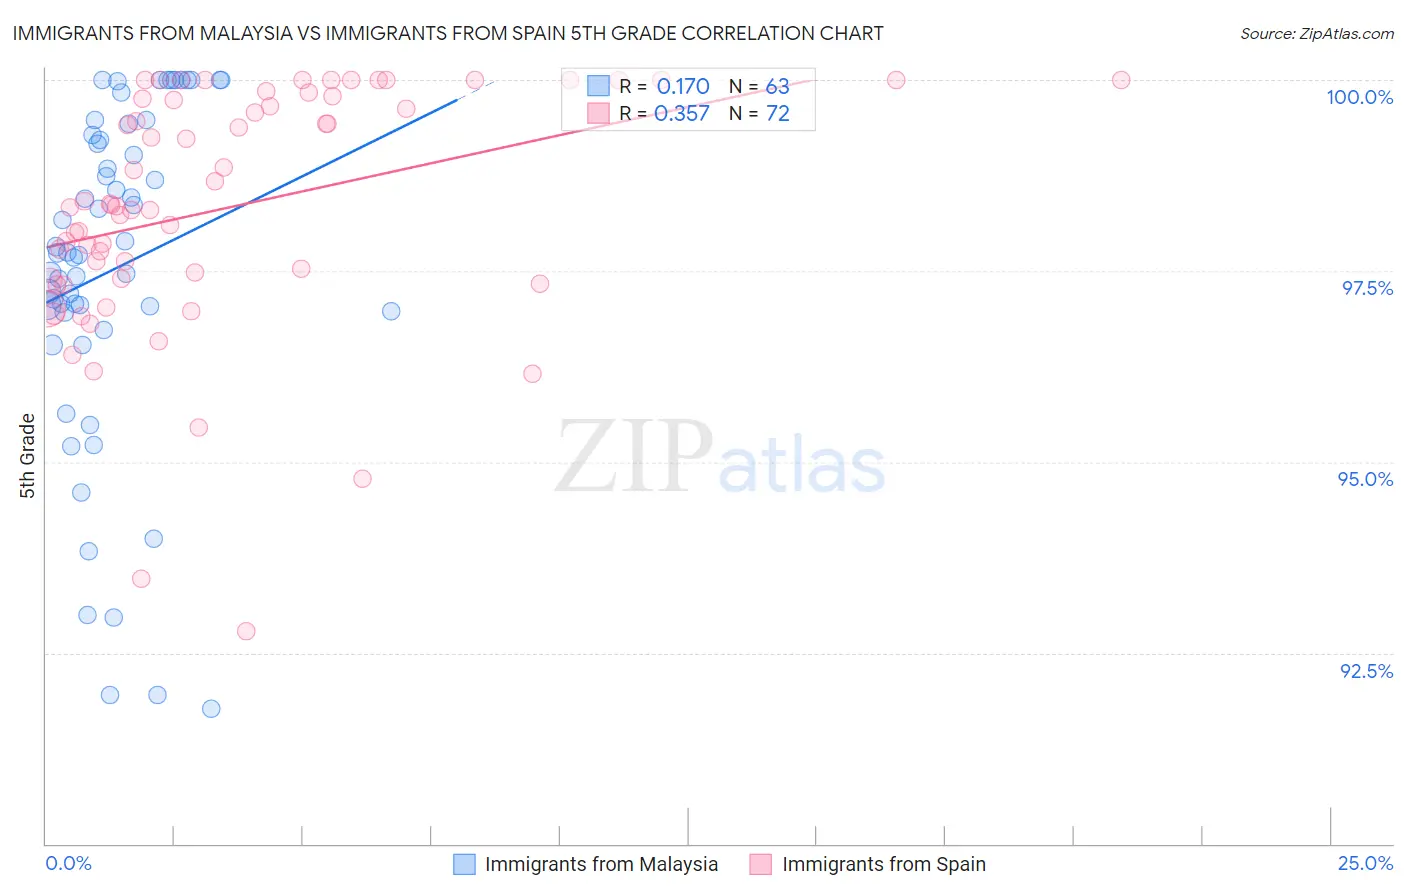
Immigrants from Malaysia vs Immigrants from Spain 5th Grade Correlation Chart
The statistical analysis conducted on geographies consisting of 197,973,709 people shows a poor positive correlation between the proportion of Immigrants from Malaysia and percentage of population with at least 5th grade education in the United States with a correlation coefficient (R) of 0.170 and weighted average of 97.0%. Similarly, the statistical analysis conducted on geographies consisting of 239,682,725 people shows a mild positive correlation between the proportion of Immigrants from Spain and percentage of population with at least 5th grade education in the United States with a correlation coefficient (R) of 0.357 and weighted average of 97.3%, a difference of 0.32%.
5th Grade Correlation Summary
| Measurement | Immigrants from Malaysia | Immigrants from Spain |
| Minimum | 91.8% | 92.8% |
| Maximum | 100.0% | 100.0% |
| Range | 8.2% | 7.2% |
| Mean | 97.5% | 98.3% |
| Median | 97.7% | 98.3% |
| Interquartile 25% (IQ1) | 97.0% | 97.4% |
| Interquartile 75% (IQ3) | 99.3% | 99.8% |
| Interquartile Range (IQR) | 2.3% | 2.4% |
| Standard Deviation (Sample) | 2.2% | 1.6% |
| Standard Deviation (Population) | 2.2% | 1.6% |
Similar Demographics by 5th Grade
Demographics Similar to Immigrants from Malaysia by 5th Grade
In terms of 5th grade, the demographic groups most similar to Immigrants from Malaysia are Immigrants from Eastern Asia (97.0%, a difference of 0.0%), Immigrants from Pakistan (97.0%, a difference of 0.010%), Assyrian/Chaldean/Syriac (97.0%, a difference of 0.010%), Yuman (97.0%, a difference of 0.010%), and Immigrants from Western Asia (97.0%, a difference of 0.010%).
| Demographics | Rating | Rank | 5th Grade |
| South American Indians | 5.4 /100 | #224 | Tragic 97.0% |
| Bahamians | 5.3 /100 | #225 | Tragic 97.0% |
| Tongans | 5.3 /100 | #226 | Tragic 97.0% |
| Immigrants | Pakistan | 4.7 /100 | #227 | Tragic 97.0% |
| Assyrians/Chaldeans/Syriacs | 4.5 /100 | #228 | Tragic 97.0% |
| Yuman | 4.5 /100 | #229 | Tragic 97.0% |
| Immigrants | Western Asia | 4.3 /100 | #230 | Tragic 97.0% |
| Immigrants | Malaysia | 4.1 /100 | #231 | Tragic 97.0% |
| Immigrants | Eastern Asia | 4.0 /100 | #232 | Tragic 97.0% |
| Sub-Saharan Africans | 3.3 /100 | #233 | Tragic 97.0% |
| Tohono O'odham | 3.2 /100 | #234 | Tragic 97.0% |
| Uruguayans | 3.2 /100 | #235 | Tragic 97.0% |
| Senegalese | 2.8 /100 | #236 | Tragic 97.0% |
| Immigrants | Indonesia | 2.0 /100 | #237 | Tragic 96.9% |
| Asians | 2.0 /100 | #238 | Tragic 96.9% |
Demographics Similar to Immigrants from Spain by 5th Grade
In terms of 5th grade, the demographic groups most similar to Immigrants from Spain are Immigrants from Kazakhstan (97.3%, a difference of 0.010%), Immigrants from Micronesia (97.3%, a difference of 0.010%), Immigrants from Taiwan (97.3%, a difference of 0.010%), Egyptian (97.3%, a difference of 0.020%), and Comanche (97.3%, a difference of 0.020%).
| Demographics | Rating | Rank | 5th Grade |
| Venezuelans | 54.0 /100 | #170 | Average 97.3% |
| Immigrants | Sri Lanka | 53.8 /100 | #171 | Average 97.3% |
| Arabs | 53.4 /100 | #172 | Average 97.3% |
| Egyptians | 52.4 /100 | #173 | Average 97.3% |
| Immigrants | Kazakhstan | 50.0 /100 | #174 | Average 97.3% |
| Immigrants | Micronesia | 48.8 /100 | #175 | Average 97.3% |
| Immigrants | Taiwan | 48.4 /100 | #176 | Average 97.3% |
| Immigrants | Spain | 47.0 /100 | #177 | Average 97.3% |
| Comanche | 42.1 /100 | #178 | Average 97.3% |
| Immigrants | Kenya | 40.3 /100 | #179 | Average 97.3% |
| Pakistanis | 40.2 /100 | #180 | Average 97.3% |
| Argentineans | 39.5 /100 | #181 | Fair 97.3% |
| Mongolians | 39.4 /100 | #182 | Fair 97.3% |
| Immigrants | Ukraine | 38.6 /100 | #183 | Fair 97.3% |
| Immigrants | Venezuela | 38.4 /100 | #184 | Fair 97.3% |