Immigrants from Italy vs Cherokee 8th Grade
COMPARE
Immigrants from Italy
Cherokee
8th Grade
8th Grade Comparison
Immigrants from Italy
Cherokee
95.8%
8TH GRADE
63.5/ 100
METRIC RATING
164th/ 347
METRIC RANK
96.5%
8TH GRADE
99.0/ 100
METRIC RATING
86th/ 347
METRIC RANK
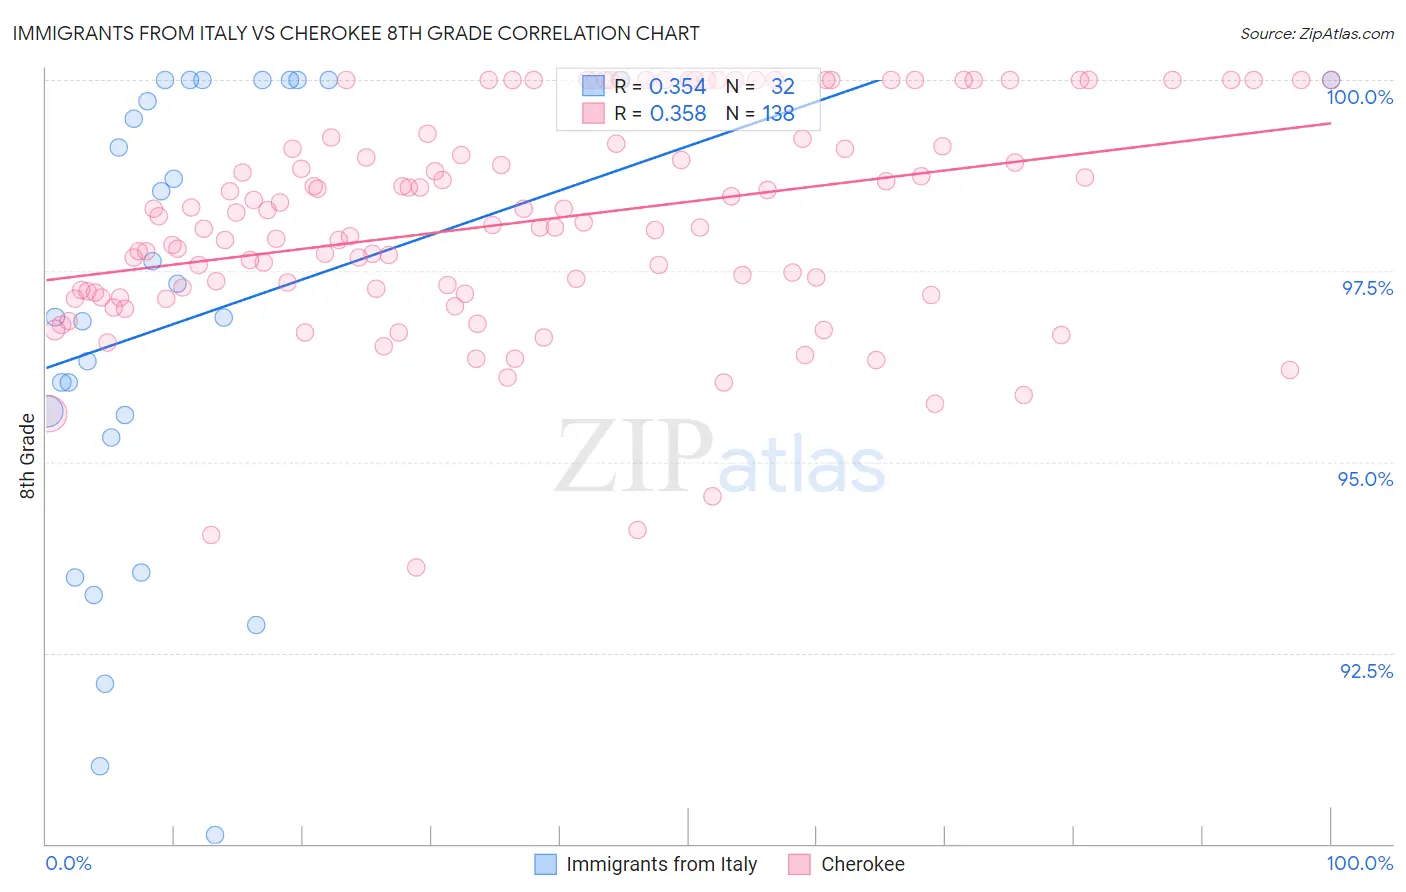
Immigrants from Italy vs Cherokee 8th Grade Correlation Chart
The statistical analysis conducted on geographies consisting of 324,226,009 people shows a mild positive correlation between the proportion of Immigrants from Italy and percentage of population with at least 8th grade education in the United States with a correlation coefficient (R) of 0.354 and weighted average of 95.8%. Similarly, the statistical analysis conducted on geographies consisting of 493,719,571 people shows a mild positive correlation between the proportion of Cherokee and percentage of population with at least 8th grade education in the United States with a correlation coefficient (R) of 0.358 and weighted average of 96.5%, a difference of 0.66%.
8th Grade Correlation Summary
| Measurement | Immigrants from Italy | Cherokee |
| Minimum | 90.1% | 93.6% |
| Maximum | 100.0% | 100.0% |
| Range | 9.9% | 6.4% |
| Mean | 97.0% | 98.2% |
| Median | 97.1% | 98.1% |
| Interquartile 25% (IQ1) | 95.5% | 97.2% |
| Interquartile 75% (IQ3) | 100.0% | 99.2% |
| Interquartile Range (IQR) | 4.5% | 2.0% |
| Standard Deviation (Sample) | 3.0% | 1.4% |
| Standard Deviation (Population) | 2.9% | 1.4% |
Similar Demographics by 8th Grade
Demographics Similar to Immigrants from Italy by 8th Grade
In terms of 8th grade, the demographic groups most similar to Immigrants from Italy are Immigrants from Sri Lanka (95.8%, a difference of 0.0%), Alsatian (95.8%, a difference of 0.010%), Immigrants from Poland (95.8%, a difference of 0.020%), Spaniard (95.8%, a difference of 0.020%), and Seminole (95.8%, a difference of 0.030%).
| Demographics | Rating | Rank | 8th Grade |
| Immigrants | Taiwan | 70.5 /100 | #157 | Good 95.9% |
| Arabs | 69.4 /100 | #158 | Good 95.9% |
| Immigrants | Kazakhstan | 68.4 /100 | #159 | Good 95.9% |
| Seminole | 67.7 /100 | #160 | Good 95.8% |
| Bermudans | 67.5 /100 | #161 | Good 95.8% |
| Immigrants | Kenya | 67.2 /100 | #162 | Good 95.8% |
| Immigrants | Sri Lanka | 64.1 /100 | #163 | Good 95.8% |
| Immigrants | Italy | 63.5 /100 | #164 | Good 95.8% |
| Alsatians | 61.4 /100 | #165 | Good 95.8% |
| Immigrants | Poland | 61.1 /100 | #166 | Good 95.8% |
| Spaniards | 60.0 /100 | #167 | Good 95.8% |
| Immigrants | Ukraine | 59.5 /100 | #168 | Average 95.8% |
| Immigrants | Iran | 58.6 /100 | #169 | Average 95.8% |
| Ute | 58.5 /100 | #170 | Average 95.8% |
| Egyptians | 58.2 /100 | #171 | Average 95.8% |
Demographics Similar to Cherokee by 8th Grade
In terms of 8th grade, the demographic groups most similar to Cherokee are Immigrants from South Africa (96.5%, a difference of 0.0%), Immigrants from Australia (96.5%, a difference of 0.0%), Immigrants from Belgium (96.5%, a difference of 0.010%), Immigrants from Western Europe (96.4%, a difference of 0.010%), and Icelander (96.5%, a difference of 0.020%).
| Demographics | Rating | Rank | 8th Grade |
| Puget Sound Salish | 99.3 /100 | #79 | Exceptional 96.5% |
| Delaware | 99.2 /100 | #80 | Exceptional 96.5% |
| Romanians | 99.2 /100 | #81 | Exceptional 96.5% |
| Turks | 99.2 /100 | #82 | Exceptional 96.5% |
| Icelanders | 99.2 /100 | #83 | Exceptional 96.5% |
| Immigrants | Belgium | 99.1 /100 | #84 | Exceptional 96.5% |
| Immigrants | South Africa | 99.1 /100 | #85 | Exceptional 96.5% |
| Cherokee | 99.0 /100 | #86 | Exceptional 96.5% |
| Immigrants | Australia | 99.0 /100 | #87 | Exceptional 96.5% |
| Immigrants | Western Europe | 99.0 /100 | #88 | Exceptional 96.4% |
| Chickasaw | 98.9 /100 | #89 | Exceptional 96.4% |
| Immigrants | Sweden | 98.9 /100 | #90 | Exceptional 96.4% |
| Thais | 98.9 /100 | #91 | Exceptional 96.4% |
| Menominee | 98.9 /100 | #92 | Exceptional 96.4% |
| Immigrants | Denmark | 98.8 /100 | #93 | Exceptional 96.4% |