Alsatian vs Cherokee 8th Grade
COMPARE
Alsatian
Cherokee
8th Grade
8th Grade Comparison
Alsatians
Cherokee
95.8%
8TH GRADE
61.4/ 100
METRIC RATING
165th/ 347
METRIC RANK
96.5%
8TH GRADE
99.0/ 100
METRIC RATING
86th/ 347
METRIC RANK
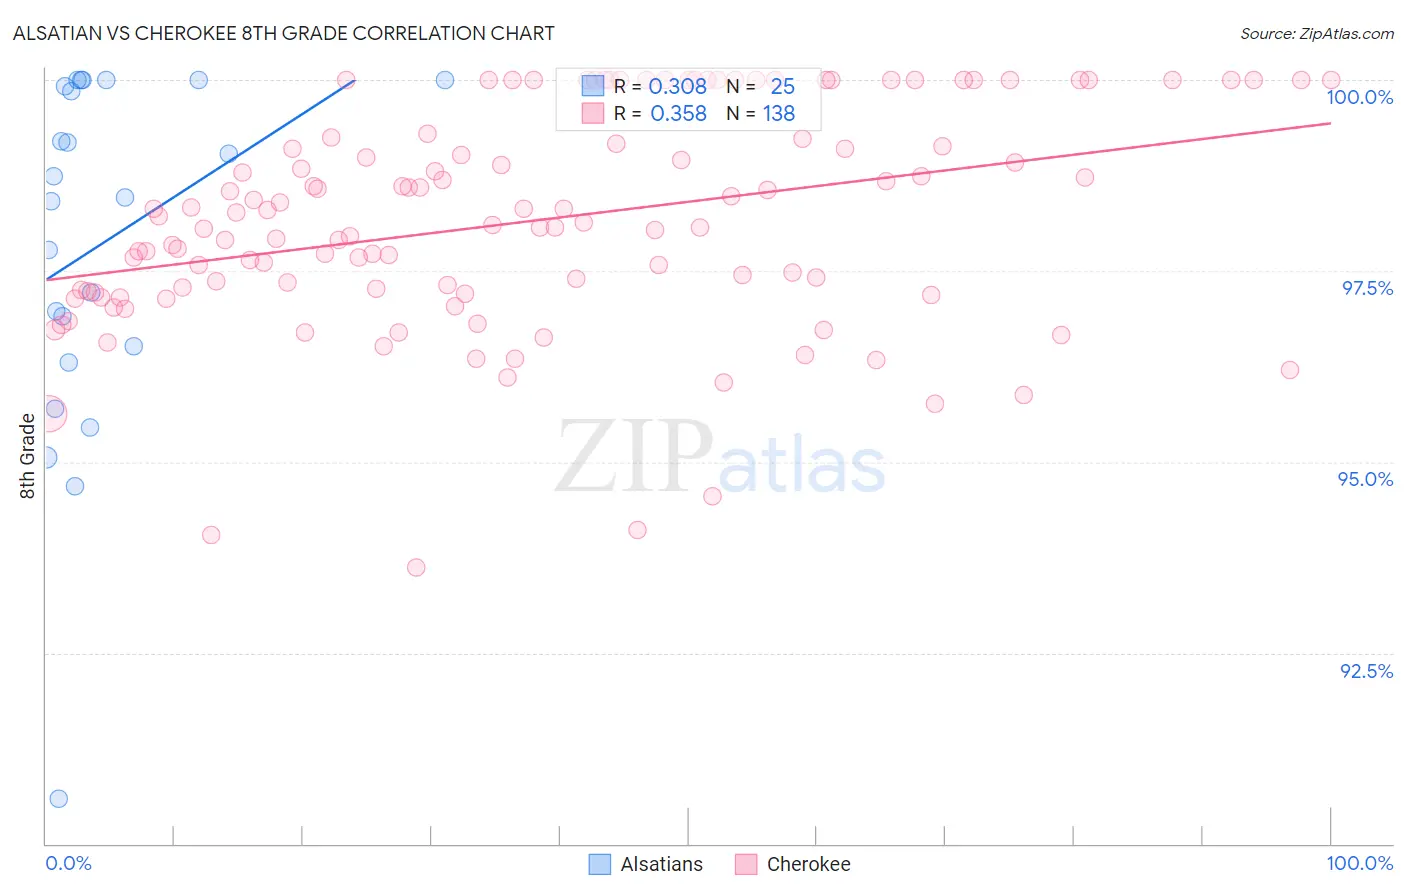
Alsatian vs Cherokee 8th Grade Correlation Chart
The statistical analysis conducted on geographies consisting of 82,682,365 people shows a mild positive correlation between the proportion of Alsatians and percentage of population with at least 8th grade education in the United States with a correlation coefficient (R) of 0.308 and weighted average of 95.8%. Similarly, the statistical analysis conducted on geographies consisting of 493,719,571 people shows a mild positive correlation between the proportion of Cherokee and percentage of population with at least 8th grade education in the United States with a correlation coefficient (R) of 0.358 and weighted average of 96.5%, a difference of 0.68%.
8th Grade Correlation Summary
| Measurement | Alsatian | Cherokee |
| Minimum | 90.6% | 93.6% |
| Maximum | 100.0% | 100.0% |
| Range | 9.4% | 6.4% |
| Mean | 97.8% | 98.2% |
| Median | 98.5% | 98.1% |
| Interquartile 25% (IQ1) | 96.4% | 97.2% |
| Interquartile 75% (IQ3) | 100.0% | 99.2% |
| Interquartile Range (IQR) | 3.5% | 2.0% |
| Standard Deviation (Sample) | 2.3% | 1.4% |
| Standard Deviation (Population) | 2.3% | 1.4% |
Similar Demographics by 8th Grade
Demographics Similar to Alsatians by 8th Grade
In terms of 8th grade, the demographic groups most similar to Alsatians are Immigrants from Poland (95.8%, a difference of 0.0%), Immigrants from Italy (95.8%, a difference of 0.010%), Spaniard (95.8%, a difference of 0.010%), Immigrants from Ukraine (95.8%, a difference of 0.010%), and Immigrants from Sri Lanka (95.8%, a difference of 0.020%).
| Demographics | Rating | Rank | 8th Grade |
| Arabs | 69.4 /100 | #158 | Good 95.9% |
| Immigrants | Kazakhstan | 68.4 /100 | #159 | Good 95.9% |
| Seminole | 67.7 /100 | #160 | Good 95.8% |
| Bermudans | 67.5 /100 | #161 | Good 95.8% |
| Immigrants | Kenya | 67.2 /100 | #162 | Good 95.8% |
| Immigrants | Sri Lanka | 64.1 /100 | #163 | Good 95.8% |
| Immigrants | Italy | 63.5 /100 | #164 | Good 95.8% |
| Alsatians | 61.4 /100 | #165 | Good 95.8% |
| Immigrants | Poland | 61.1 /100 | #166 | Good 95.8% |
| Spaniards | 60.0 /100 | #167 | Good 95.8% |
| Immigrants | Ukraine | 59.5 /100 | #168 | Average 95.8% |
| Immigrants | Iran | 58.6 /100 | #169 | Average 95.8% |
| Ute | 58.5 /100 | #170 | Average 95.8% |
| Egyptians | 58.2 /100 | #171 | Average 95.8% |
| Immigrants | Korea | 57.9 /100 | #172 | Average 95.8% |
Demographics Similar to Cherokee by 8th Grade
In terms of 8th grade, the demographic groups most similar to Cherokee are Immigrants from South Africa (96.5%, a difference of 0.0%), Immigrants from Australia (96.5%, a difference of 0.0%), Immigrants from Belgium (96.5%, a difference of 0.010%), Immigrants from Western Europe (96.4%, a difference of 0.010%), and Icelander (96.5%, a difference of 0.020%).
| Demographics | Rating | Rank | 8th Grade |
| Puget Sound Salish | 99.3 /100 | #79 | Exceptional 96.5% |
| Delaware | 99.2 /100 | #80 | Exceptional 96.5% |
| Romanians | 99.2 /100 | #81 | Exceptional 96.5% |
| Turks | 99.2 /100 | #82 | Exceptional 96.5% |
| Icelanders | 99.2 /100 | #83 | Exceptional 96.5% |
| Immigrants | Belgium | 99.1 /100 | #84 | Exceptional 96.5% |
| Immigrants | South Africa | 99.1 /100 | #85 | Exceptional 96.5% |
| Cherokee | 99.0 /100 | #86 | Exceptional 96.5% |
| Immigrants | Australia | 99.0 /100 | #87 | Exceptional 96.5% |
| Immigrants | Western Europe | 99.0 /100 | #88 | Exceptional 96.4% |
| Chickasaw | 98.9 /100 | #89 | Exceptional 96.4% |
| Immigrants | Sweden | 98.9 /100 | #90 | Exceptional 96.4% |
| Thais | 98.9 /100 | #91 | Exceptional 96.4% |
| Menominee | 98.9 /100 | #92 | Exceptional 96.4% |
| Immigrants | Denmark | 98.8 /100 | #93 | Exceptional 96.4% |