Somali vs American Nursery School
COMPARE
Somali
American
Nursery School
Nursery School Comparison
Somalis
Americans
97.1%
NURSERY SCHOOL
0.0/ 100
METRIC RATING
305th/ 347
METRIC RANK
98.4%
NURSERY SCHOOL
99.8/ 100
METRIC RATING
56th/ 347
METRIC RANK
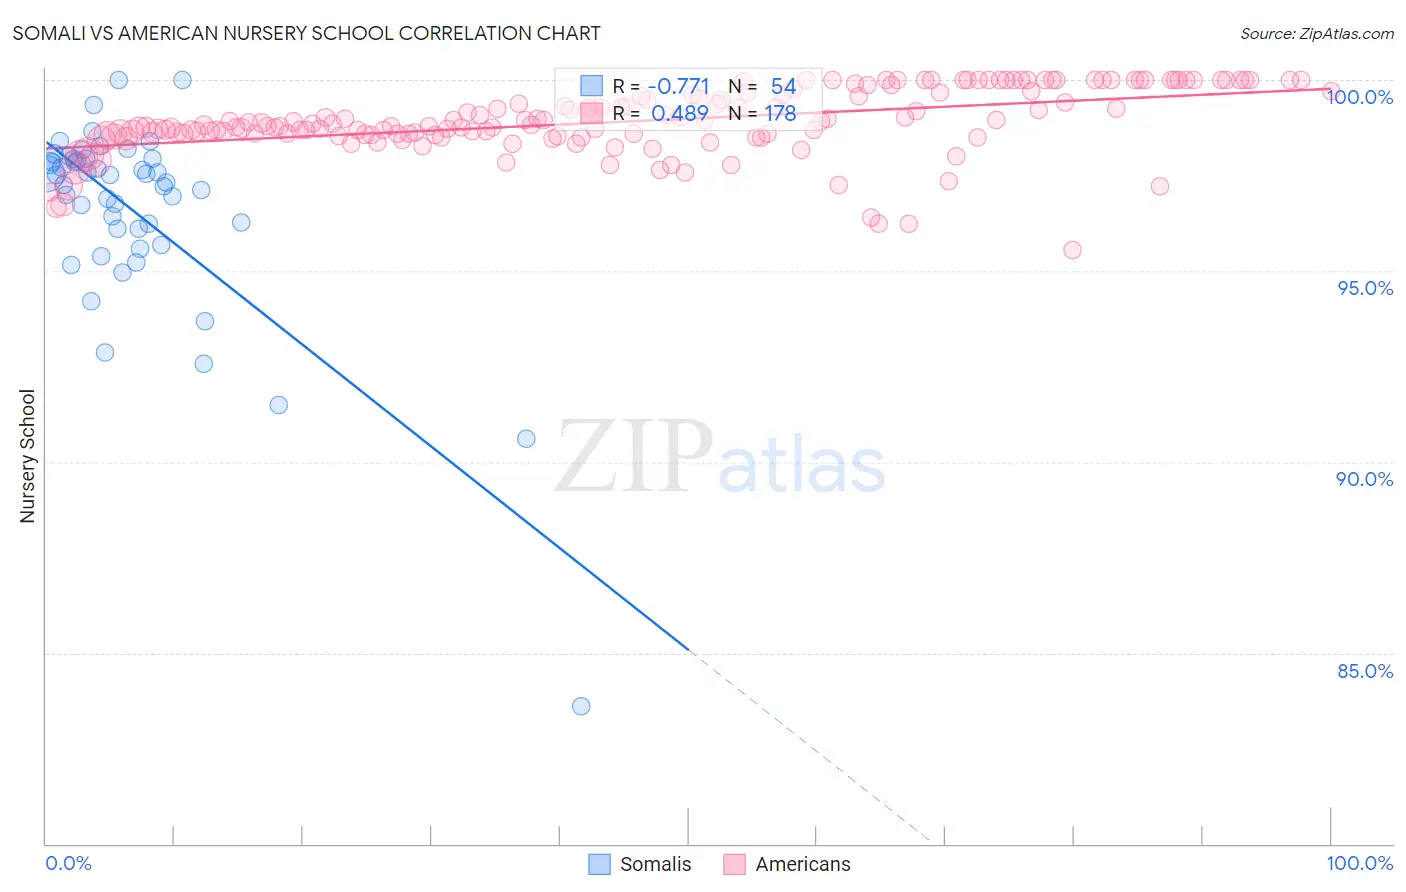
Somali vs American Nursery School Correlation Chart
The statistical analysis conducted on geographies consisting of 99,332,457 people shows a strong negative correlation between the proportion of Somalis and percentage of population with at least nursery school education in the United States with a correlation coefficient (R) of -0.771 and weighted average of 97.1%. Similarly, the statistical analysis conducted on geographies consisting of 581,989,447 people shows a moderate positive correlation between the proportion of Americans and percentage of population with at least nursery school education in the United States with a correlation coefficient (R) of 0.489 and weighted average of 98.4%, a difference of 1.4%.
Nursery School Correlation Summary
| Measurement | Somali | American |
| Minimum | 83.6% | 95.5% |
| Maximum | 100.0% | 100.0% |
| Range | 16.4% | 4.5% |
| Mean | 96.6% | 98.9% |
| Median | 97.4% | 98.8% |
| Interquartile 25% (IQ1) | 96.1% | 98.6% |
| Interquartile 75% (IQ3) | 97.9% | 99.7% |
| Interquartile Range (IQR) | 1.8% | 1.1% |
| Standard Deviation (Sample) | 2.6% | 0.87% |
| Standard Deviation (Population) | 2.6% | 0.86% |
Similar Demographics by Nursery School
Demographics Similar to Somalis by Nursery School
In terms of nursery school, the demographic groups most similar to Somalis are Ecuadorian (97.1%, a difference of 0.0%), Nicaraguan (97.1%, a difference of 0.010%), Immigrants from Caribbean (97.1%, a difference of 0.040%), Belizean (97.0%, a difference of 0.060%), and Immigrants from South Eastern Asia (97.1%, a difference of 0.070%).
| Demographics | Rating | Rank | Nursery School |
| Central American Indians | 0.0 /100 | #298 | Tragic 97.2% |
| Immigrants | Dominica | 0.0 /100 | #299 | Tragic 97.2% |
| Haitians | 0.0 /100 | #300 | Tragic 97.2% |
| Immigrants | South Eastern Asia | 0.0 /100 | #301 | Tragic 97.1% |
| Immigrants | Caribbean | 0.0 /100 | #302 | Tragic 97.1% |
| Nicaraguans | 0.0 /100 | #303 | Tragic 97.1% |
| Ecuadorians | 0.0 /100 | #304 | Tragic 97.1% |
| Somalis | 0.0 /100 | #305 | Tragic 97.1% |
| Belizeans | 0.0 /100 | #306 | Tragic 97.0% |
| Hispanics or Latinos | 0.0 /100 | #307 | Tragic 97.0% |
| Immigrants | Haiti | 0.0 /100 | #308 | Tragic 97.0% |
| Immigrants | Somalia | 0.0 /100 | #309 | Tragic 97.0% |
| Guyanese | 0.0 /100 | #310 | Tragic 97.0% |
| Immigrants | Azores | 0.0 /100 | #311 | Tragic 97.0% |
| Sri Lankans | 0.0 /100 | #312 | Tragic 97.0% |
Demographics Similar to Americans by Nursery School
In terms of nursery school, the demographic groups most similar to Americans are Austrian (98.4%, a difference of 0.0%), Bulgarian (98.4%, a difference of 0.0%), Kiowa (98.4%, a difference of 0.010%), Pueblo (98.4%, a difference of 0.010%), and Immigrants from Scotland (98.4%, a difference of 0.010%).
| Demographics | Rating | Rank | Nursery School |
| Whites/Caucasians | 99.8 /100 | #49 | Exceptional 98.5% |
| Celtics | 99.8 /100 | #50 | Exceptional 98.5% |
| Estonians | 99.8 /100 | #51 | Exceptional 98.5% |
| Australians | 99.8 /100 | #52 | Exceptional 98.5% |
| Kiowa | 99.8 /100 | #53 | Exceptional 98.4% |
| Pueblo | 99.8 /100 | #54 | Exceptional 98.4% |
| Immigrants | Scotland | 99.8 /100 | #55 | Exceptional 98.4% |
| Americans | 99.8 /100 | #56 | Exceptional 98.4% |
| Austrians | 99.8 /100 | #57 | Exceptional 98.4% |
| Bulgarians | 99.8 /100 | #58 | Exceptional 98.4% |
| Immigrants | Canada | 99.8 /100 | #59 | Exceptional 98.4% |
| Slavs | 99.8 /100 | #60 | Exceptional 98.4% |
| New Zealanders | 99.7 /100 | #61 | Exceptional 98.4% |
| Creek | 99.7 /100 | #62 | Exceptional 98.4% |
| Immigrants | North America | 99.7 /100 | #63 | Exceptional 98.4% |