Somali vs Immigrants from Sri Lanka Nursery School
COMPARE
Somali
Immigrants from Sri Lanka
Nursery School
Nursery School Comparison
Somalis
Immigrants from Sri Lanka
97.1%
NURSERY SCHOOL
0.0/ 100
METRIC RATING
305th/ 347
METRIC RANK
98.0%
NURSERY SCHOOL
49.9/ 100
METRIC RATING
175th/ 347
METRIC RANK
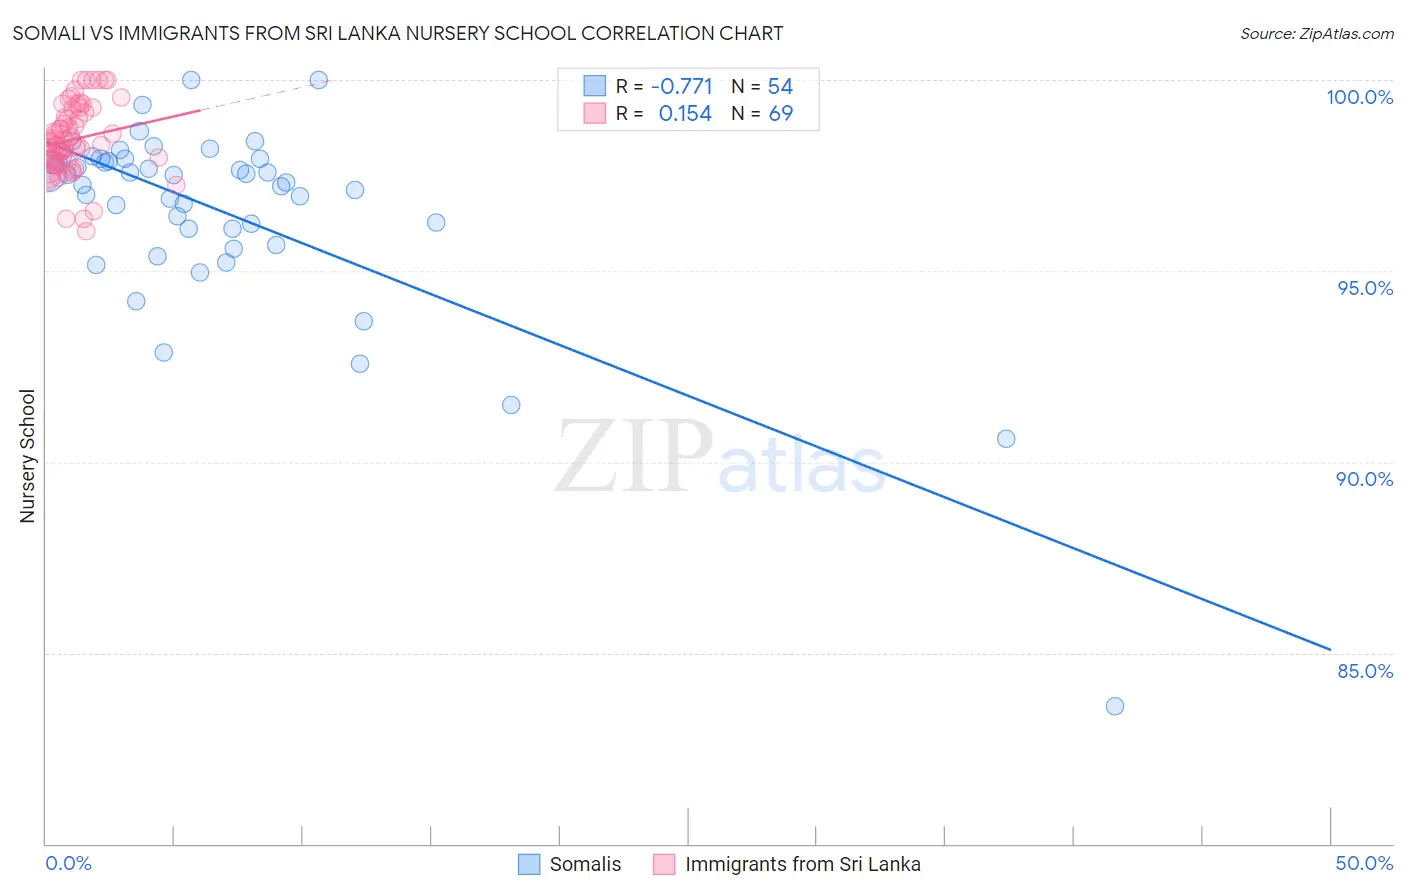
Somali vs Immigrants from Sri Lanka Nursery School Correlation Chart
The statistical analysis conducted on geographies consisting of 99,332,457 people shows a strong negative correlation between the proportion of Somalis and percentage of population with at least nursery school education in the United States with a correlation coefficient (R) of -0.771 and weighted average of 97.1%. Similarly, the statistical analysis conducted on geographies consisting of 149,700,552 people shows a poor positive correlation between the proportion of Immigrants from Sri Lanka and percentage of population with at least nursery school education in the United States with a correlation coefficient (R) of 0.154 and weighted average of 98.0%, a difference of 0.94%.
Nursery School Correlation Summary
| Measurement | Somali | Immigrants from Sri Lanka |
| Minimum | 83.6% | 96.0% |
| Maximum | 100.0% | 100.0% |
| Range | 16.4% | 4.0% |
| Mean | 96.6% | 98.4% |
| Median | 97.4% | 98.4% |
| Interquartile 25% (IQ1) | 96.1% | 97.9% |
| Interquartile 75% (IQ3) | 97.9% | 99.2% |
| Interquartile Range (IQR) | 1.8% | 1.3% |
| Standard Deviation (Sample) | 2.6% | 0.91% |
| Standard Deviation (Population) | 2.6% | 0.90% |
Similar Demographics by Nursery School
Demographics Similar to Somalis by Nursery School
In terms of nursery school, the demographic groups most similar to Somalis are Ecuadorian (97.1%, a difference of 0.0%), Nicaraguan (97.1%, a difference of 0.010%), Immigrants from Caribbean (97.1%, a difference of 0.040%), Belizean (97.0%, a difference of 0.060%), and Immigrants from South Eastern Asia (97.1%, a difference of 0.070%).
| Demographics | Rating | Rank | Nursery School |
| Central American Indians | 0.0 /100 | #298 | Tragic 97.2% |
| Immigrants | Dominica | 0.0 /100 | #299 | Tragic 97.2% |
| Haitians | 0.0 /100 | #300 | Tragic 97.2% |
| Immigrants | South Eastern Asia | 0.0 /100 | #301 | Tragic 97.1% |
| Immigrants | Caribbean | 0.0 /100 | #302 | Tragic 97.1% |
| Nicaraguans | 0.0 /100 | #303 | Tragic 97.1% |
| Ecuadorians | 0.0 /100 | #304 | Tragic 97.1% |
| Somalis | 0.0 /100 | #305 | Tragic 97.1% |
| Belizeans | 0.0 /100 | #306 | Tragic 97.0% |
| Hispanics or Latinos | 0.0 /100 | #307 | Tragic 97.0% |
| Immigrants | Haiti | 0.0 /100 | #308 | Tragic 97.0% |
| Immigrants | Somalia | 0.0 /100 | #309 | Tragic 97.0% |
| Guyanese | 0.0 /100 | #310 | Tragic 97.0% |
| Immigrants | Azores | 0.0 /100 | #311 | Tragic 97.0% |
| Sri Lankans | 0.0 /100 | #312 | Tragic 97.0% |
Demographics Similar to Immigrants from Sri Lanka by Nursery School
In terms of nursery school, the demographic groups most similar to Immigrants from Sri Lanka are Immigrants from Brazil (98.0%, a difference of 0.0%), Kenyan (98.0%, a difference of 0.0%), Navajo (98.0%, a difference of 0.0%), Immigrants from Venezuela (98.0%, a difference of 0.0%), and Albanian (98.0%, a difference of 0.0%).
| Demographics | Rating | Rank | Nursery School |
| Immigrants | Micronesia | 55.0 /100 | #168 | Average 98.0% |
| Immigrants | Korea | 53.8 /100 | #169 | Average 98.0% |
| Bermudans | 53.7 /100 | #170 | Average 98.0% |
| Immigrants | Jordan | 53.4 /100 | #171 | Average 98.0% |
| Immigrants | Brazil | 51.3 /100 | #172 | Average 98.0% |
| Kenyans | 50.2 /100 | #173 | Average 98.0% |
| Navajo | 50.0 /100 | #174 | Average 98.0% |
| Immigrants | Sri Lanka | 49.9 /100 | #175 | Average 98.0% |
| Immigrants | Venezuela | 49.8 /100 | #176 | Average 98.0% |
| Albanians | 48.9 /100 | #177 | Average 98.0% |
| Natives/Alaskans | 48.6 /100 | #178 | Average 98.0% |
| Argentineans | 46.8 /100 | #179 | Average 98.0% |
| Immigrants | Bosnia and Herzegovina | 45.6 /100 | #180 | Average 98.0% |
| Egyptians | 42.8 /100 | #181 | Average 98.0% |
| Paiute | 42.0 /100 | #182 | Average 98.0% |