German vs American Nursery School
COMPARE
German
American
Nursery School
Nursery School Comparison
Germans
Americans
98.7%
NURSERY SCHOOL
100.0/ 100
METRIC RATING
10th/ 347
METRIC RANK
98.4%
NURSERY SCHOOL
99.8/ 100
METRIC RATING
56th/ 347
METRIC RANK
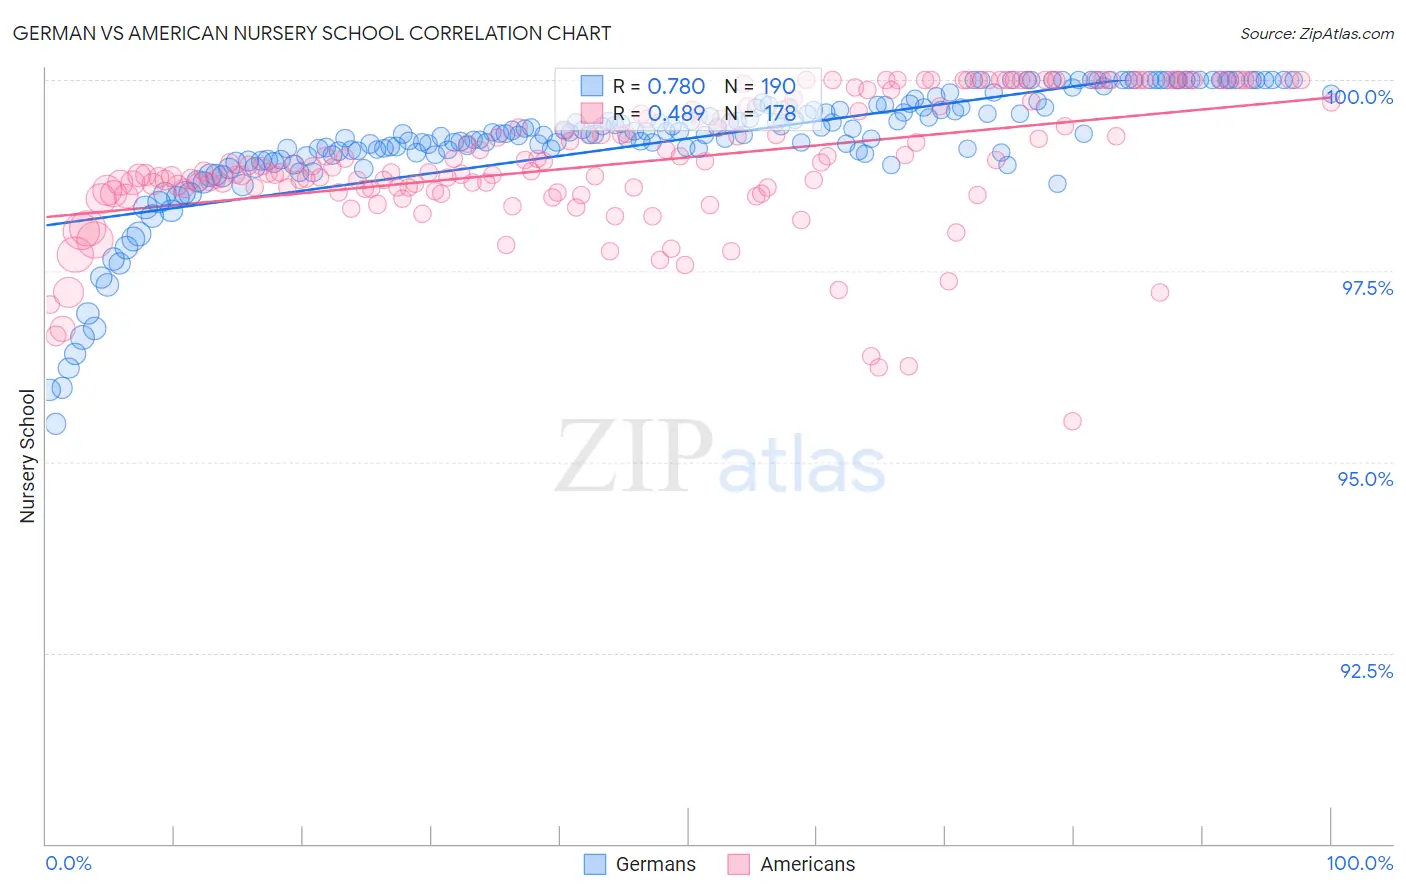
German vs American Nursery School Correlation Chart
The statistical analysis conducted on geographies consisting of 581,302,427 people shows a strong positive correlation between the proportion of Germans and percentage of population with at least nursery school education in the United States with a correlation coefficient (R) of 0.780 and weighted average of 98.7%. Similarly, the statistical analysis conducted on geographies consisting of 581,989,447 people shows a moderate positive correlation between the proportion of Americans and percentage of population with at least nursery school education in the United States with a correlation coefficient (R) of 0.489 and weighted average of 98.4%, a difference of 0.30%.
Nursery School Correlation Summary
| Measurement | German | American |
| Minimum | 95.5% | 95.5% |
| Maximum | 100.0% | 100.0% |
| Range | 4.5% | 4.5% |
| Mean | 99.2% | 98.9% |
| Median | 99.3% | 98.8% |
| Interquartile 25% (IQ1) | 99.0% | 98.6% |
| Interquartile 75% (IQ3) | 99.6% | 99.7% |
| Interquartile Range (IQR) | 0.61% | 1.1% |
| Standard Deviation (Sample) | 0.81% | 0.87% |
| Standard Deviation (Population) | 0.81% | 0.86% |
Similar Demographics by Nursery School
Demographics Similar to Germans by Nursery School
In terms of nursery school, the demographic groups most similar to Germans are Slovak (98.7%, a difference of 0.0%), Tlingit-Haida (98.7%, a difference of 0.0%), Norwegian (98.7%, a difference of 0.020%), Slovene (98.7%, a difference of 0.020%), and Alaska Native (98.8%, a difference of 0.040%).
| Demographics | Rating | Rank | Nursery School |
| Welsh | 100.0 /100 | #3 | Exceptional 98.9% |
| Inupiat | 100.0 /100 | #4 | Exceptional 98.9% |
| Tsimshian | 100.0 /100 | #5 | Exceptional 98.9% |
| Alaskan Athabascans | 100.0 /100 | #6 | Exceptional 98.8% |
| Alaska Natives | 100.0 /100 | #7 | Exceptional 98.8% |
| Norwegians | 100.0 /100 | #8 | Exceptional 98.7% |
| Slovaks | 100.0 /100 | #9 | Exceptional 98.7% |
| Germans | 100.0 /100 | #10 | Exceptional 98.7% |
| Tlingit-Haida | 100.0 /100 | #11 | Exceptional 98.7% |
| Slovenes | 100.0 /100 | #12 | Exceptional 98.7% |
| English | 100.0 /100 | #13 | Exceptional 98.7% |
| Carpatho Rusyns | 100.0 /100 | #14 | Exceptional 98.7% |
| Swedes | 100.0 /100 | #15 | Exceptional 98.7% |
| Scottish | 100.0 /100 | #16 | Exceptional 98.7% |
| Aleuts | 100.0 /100 | #17 | Exceptional 98.7% |
Demographics Similar to Americans by Nursery School
In terms of nursery school, the demographic groups most similar to Americans are Austrian (98.4%, a difference of 0.0%), Bulgarian (98.4%, a difference of 0.0%), Kiowa (98.4%, a difference of 0.010%), Pueblo (98.4%, a difference of 0.010%), and Immigrants from Scotland (98.4%, a difference of 0.010%).
| Demographics | Rating | Rank | Nursery School |
| Whites/Caucasians | 99.8 /100 | #49 | Exceptional 98.5% |
| Celtics | 99.8 /100 | #50 | Exceptional 98.5% |
| Estonians | 99.8 /100 | #51 | Exceptional 98.5% |
| Australians | 99.8 /100 | #52 | Exceptional 98.5% |
| Kiowa | 99.8 /100 | #53 | Exceptional 98.4% |
| Pueblo | 99.8 /100 | #54 | Exceptional 98.4% |
| Immigrants | Scotland | 99.8 /100 | #55 | Exceptional 98.4% |
| Americans | 99.8 /100 | #56 | Exceptional 98.4% |
| Austrians | 99.8 /100 | #57 | Exceptional 98.4% |
| Bulgarians | 99.8 /100 | #58 | Exceptional 98.4% |
| Immigrants | Canada | 99.8 /100 | #59 | Exceptional 98.4% |
| Slavs | 99.8 /100 | #60 | Exceptional 98.4% |
| New Zealanders | 99.7 /100 | #61 | Exceptional 98.4% |
| Creek | 99.7 /100 | #62 | Exceptional 98.4% |
| Immigrants | North America | 99.7 /100 | #63 | Exceptional 98.4% |