Slovene vs Guamanian/Chamorro Doctorate Degree
COMPARE
Slovene
Guamanian/Chamorro
Doctorate Degree
Doctorate Degree Comparison
Slovenes
Guamanians/Chamorros
1.9%
DOCTORATE DEGREE
70.2/ 100
METRIC RATING
159th/ 347
METRIC RANK
1.6%
DOCTORATE DEGREE
3.3/ 100
METRIC RATING
232nd/ 347
METRIC RANK
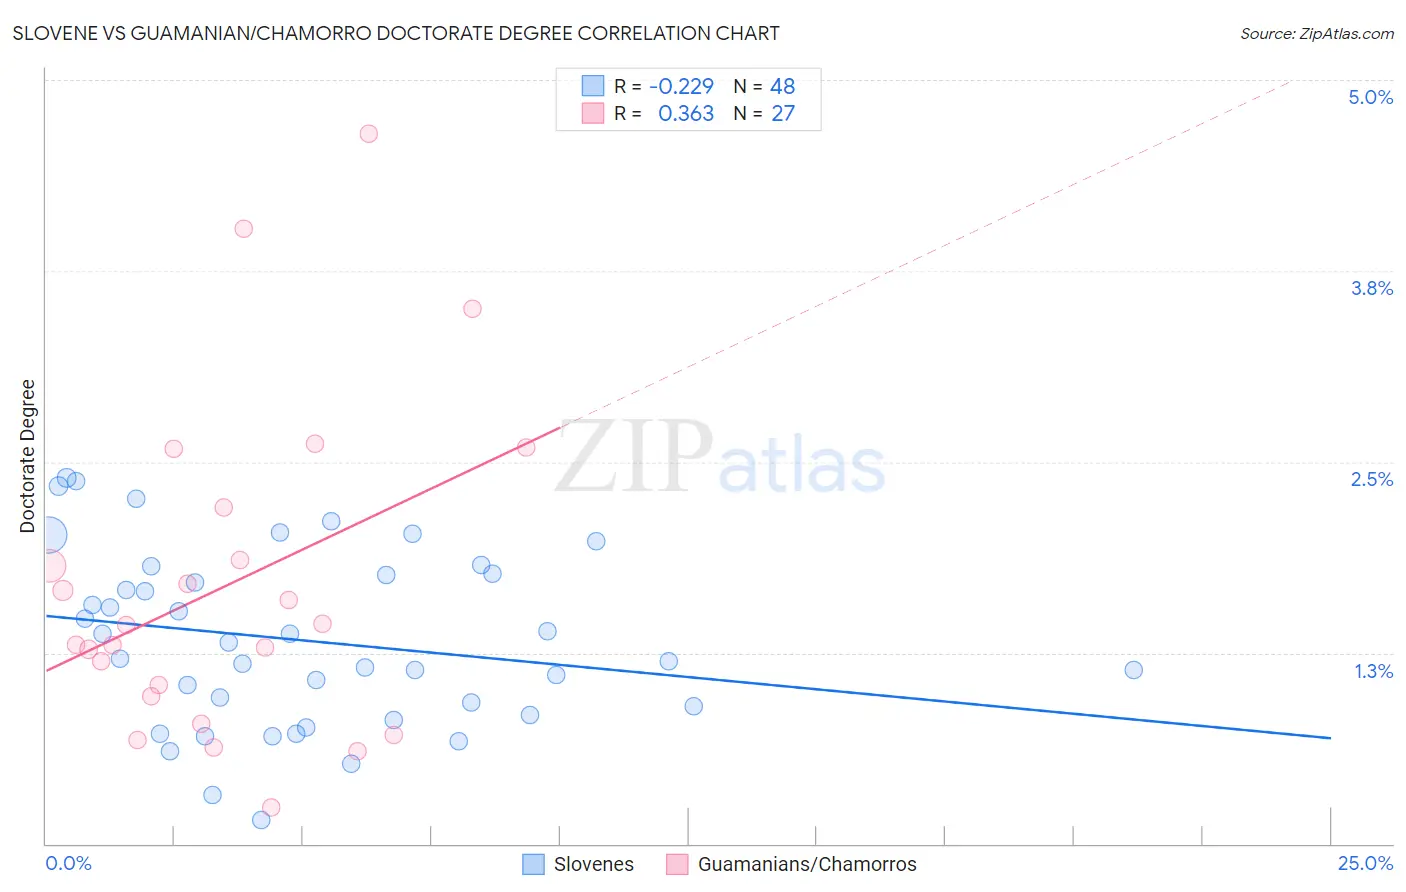
Slovene vs Guamanian/Chamorro Doctorate Degree Correlation Chart
The statistical analysis conducted on geographies consisting of 259,569,588 people shows a weak negative correlation between the proportion of Slovenes and percentage of population with at least doctorate degree education in the United States with a correlation coefficient (R) of -0.229 and weighted average of 1.9%. Similarly, the statistical analysis conducted on geographies consisting of 220,575,272 people shows a mild positive correlation between the proportion of Guamanians/Chamorros and percentage of population with at least doctorate degree education in the United States with a correlation coefficient (R) of 0.363 and weighted average of 1.6%, a difference of 17.7%.
Doctorate Degree Correlation Summary
| Measurement | Slovene | Guamanian/Chamorro |
| Minimum | 0.15% | 0.23% |
| Maximum | 2.4% | 4.6% |
| Range | 2.2% | 4.4% |
| Mean | 1.3% | 1.7% |
| Median | 1.3% | 1.4% |
| Interquartile 25% (IQ1) | 0.87% | 0.97% |
| Interquartile 75% (IQ3) | 1.8% | 2.2% |
| Interquartile Range (IQR) | 0.89% | 1.2% |
| Standard Deviation (Sample) | 0.57% | 1.1% |
| Standard Deviation (Population) | 0.56% | 1.0% |
Similar Demographics by Doctorate Degree
Demographics Similar to Slovenes by Doctorate Degree
In terms of doctorate degree, the demographic groups most similar to Slovenes are Welsh (1.9%, a difference of 0.090%), Immigrants from Middle Africa (1.9%, a difference of 0.24%), Hungarian (1.9%, a difference of 0.26%), Danish (1.9%, a difference of 0.29%), and Slavic (1.9%, a difference of 0.37%).
| Demographics | Rating | Rank | Doctorate Degree |
| Immigrants | Kenya | 74.3 /100 | #152 | Good 1.9% |
| Immigrants | Oceania | 74.0 /100 | #153 | Good 1.9% |
| Immigrants | Albania | 72.8 /100 | #154 | Good 1.9% |
| Poles | 72.7 /100 | #155 | Good 1.9% |
| Slavs | 72.4 /100 | #156 | Good 1.9% |
| Danes | 71.9 /100 | #157 | Good 1.9% |
| Hungarians | 71.7 /100 | #158 | Good 1.9% |
| Slovenes | 70.2 /100 | #159 | Good 1.9% |
| Welsh | 69.7 /100 | #160 | Good 1.9% |
| Immigrants | Middle Africa | 68.8 /100 | #161 | Good 1.9% |
| Irish | 67.5 /100 | #162 | Good 1.9% |
| Czechs | 67.3 /100 | #163 | Good 1.9% |
| Celtics | 66.7 /100 | #164 | Good 1.9% |
| Scotch-Irish | 63.6 /100 | #165 | Good 1.9% |
| Spaniards | 63.5 /100 | #166 | Good 1.9% |
Demographics Similar to Guamanians/Chamorros by Doctorate Degree
In terms of doctorate degree, the demographic groups most similar to Guamanians/Chamorros are Barbadian (1.6%, a difference of 0.070%), Hopi (1.6%, a difference of 0.21%), Cree (1.6%, a difference of 0.43%), Immigrants from North Macedonia (1.6%, a difference of 0.69%), and Indonesian (1.6%, a difference of 0.71%).
| Demographics | Rating | Rank | Doctorate Degree |
| Immigrants | Colombia | 6.7 /100 | #225 | Tragic 1.7% |
| Osage | 6.5 /100 | #226 | Tragic 1.7% |
| Panamanians | 6.3 /100 | #227 | Tragic 1.7% |
| Assyrians/Chaldeans/Syriacs | 5.9 /100 | #228 | Tragic 1.7% |
| Colville | 4.7 /100 | #229 | Tragic 1.6% |
| Immigrants | Philippines | 4.3 /100 | #230 | Tragic 1.6% |
| Immigrants | North Macedonia | 3.9 /100 | #231 | Tragic 1.6% |
| Guamanians/Chamorros | 3.3 /100 | #232 | Tragic 1.6% |
| Barbadians | 3.3 /100 | #233 | Tragic 1.6% |
| Hopi | 3.2 /100 | #234 | Tragic 1.6% |
| Cree | 3.0 /100 | #235 | Tragic 1.6% |
| Indonesians | 2.8 /100 | #236 | Tragic 1.6% |
| Iroquois | 2.7 /100 | #237 | Tragic 1.6% |
| Immigrants | Congo | 2.6 /100 | #238 | Tragic 1.6% |
| West Indians | 2.5 /100 | #239 | Tragic 1.6% |