Slovak vs Laotian No Schooling Completed
COMPARE
Slovak
Laotian
No Schooling Completed
No Schooling Completed Comparison
Slovaks
Laotians
1.3%
NO SCHOOLING COMPLETED
100.0/ 100
METRIC RATING
2nd/ 347
METRIC RANK
2.2%
NO SCHOOLING COMPLETED
13.3/ 100
METRIC RATING
203rd/ 347
METRIC RANK
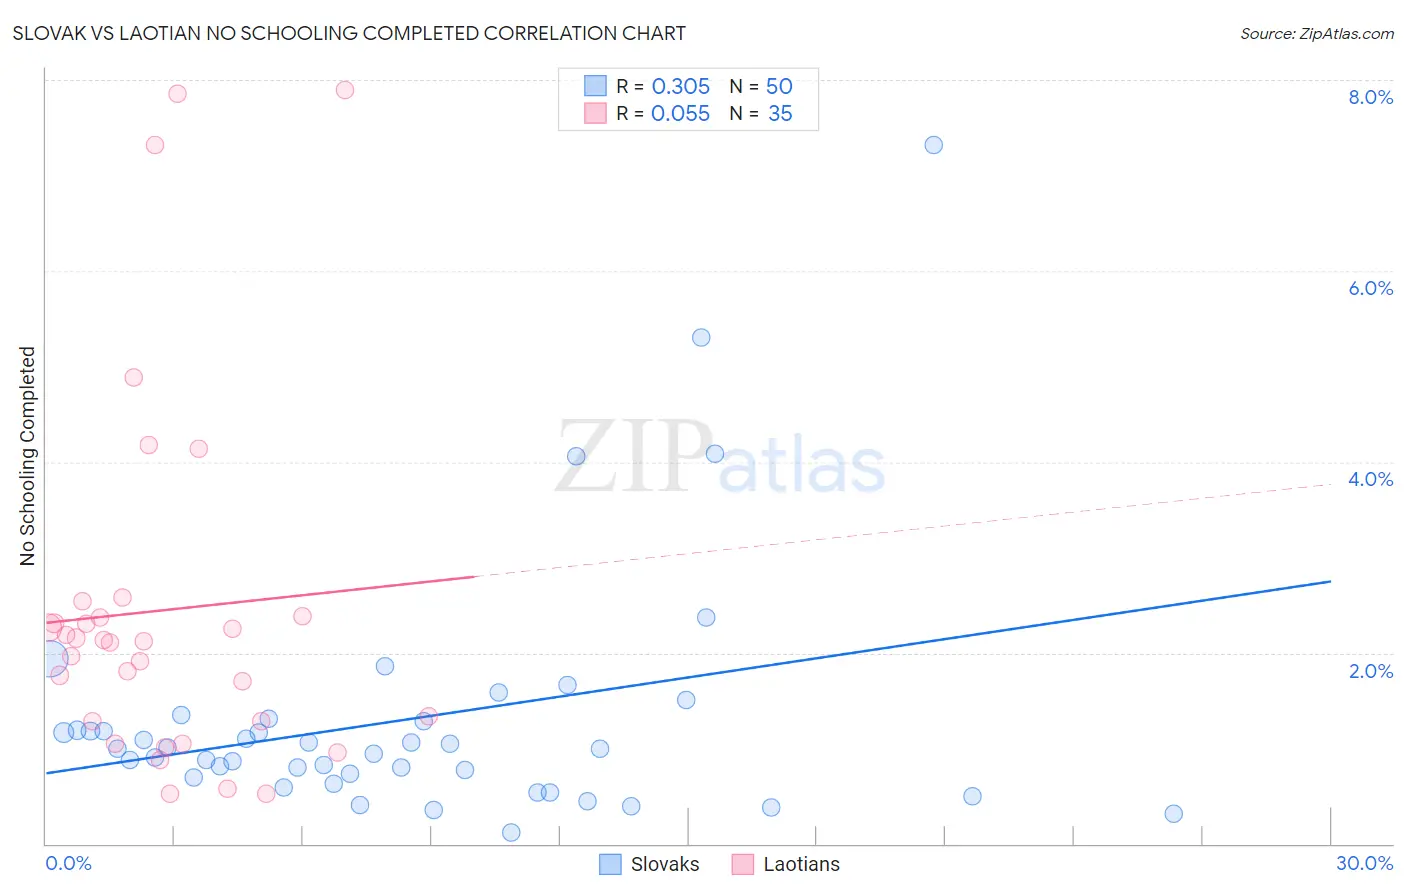
Slovak vs Laotian No Schooling Completed Correlation Chart
The statistical analysis conducted on geographies consisting of 391,654,464 people shows a mild positive correlation between the proportion of Slovaks and percentage of population with no schooling in the United States with a correlation coefficient (R) of 0.305 and weighted average of 1.3%. Similarly, the statistical analysis conducted on geographies consisting of 223,538,268 people shows a slight positive correlation between the proportion of Laotians and percentage of population with no schooling in the United States with a correlation coefficient (R) of 0.055 and weighted average of 2.2%, a difference of 65.6%.
No Schooling Completed Correlation Summary
| Measurement | Slovak | Laotian |
| Minimum | 0.11% | 0.52% |
| Maximum | 7.3% | 7.9% |
| Range | 7.2% | 7.4% |
| Mean | 1.3% | 2.4% |
| Median | 1.00% | 2.1% |
| Interquartile 25% (IQ1) | 0.70% | 1.3% |
| Interquartile 75% (IQ3) | 1.3% | 2.4% |
| Interquartile Range (IQR) | 0.59% | 1.1% |
| Standard Deviation (Sample) | 1.3% | 1.9% |
| Standard Deviation (Population) | 1.3% | 1.9% |
Similar Demographics by No Schooling Completed
Demographics Similar to Slovaks by No Schooling Completed
In terms of no schooling completed, the demographic groups most similar to Slovaks are Norwegian (1.3%, a difference of 0.43%), German (1.4%, a difference of 0.99%), Slovene (1.4%, a difference of 1.4%), Carpatho Rusyn (1.4%, a difference of 2.2%), and English (1.4%, a difference of 3.2%).
| Demographics | Rating | Rank | No Schooling Completed |
| Yup'ik | 100.0 /100 | #1 | Exceptional 1.2% |
| Slovaks | 100.0 /100 | #2 | Exceptional 1.3% |
| Norwegians | 100.0 /100 | #3 | Exceptional 1.3% |
| Germans | 100.0 /100 | #4 | Exceptional 1.4% |
| Slovenes | 100.0 /100 | #5 | Exceptional 1.4% |
| Carpatho Rusyns | 100.0 /100 | #6 | Exceptional 1.4% |
| English | 100.0 /100 | #7 | Exceptional 1.4% |
| Swedes | 100.0 /100 | #8 | Exceptional 1.4% |
| Scottish | 100.0 /100 | #9 | Exceptional 1.4% |
| Dutch | 100.0 /100 | #10 | Exceptional 1.4% |
| Lithuanians | 100.0 /100 | #11 | Exceptional 1.4% |
| Irish | 100.0 /100 | #12 | Exceptional 1.4% |
| Poles | 100.0 /100 | #13 | Exceptional 1.4% |
| Scotch-Irish | 100.0 /100 | #14 | Exceptional 1.5% |
| Tlingit-Haida | 100.0 /100 | #15 | Exceptional 1.5% |
Demographics Similar to Laotians by No Schooling Completed
In terms of no schooling completed, the demographic groups most similar to Laotians are Moroccan (2.2%, a difference of 0.11%), Hopi (2.2%, a difference of 0.11%), Immigrants from Bahamas (2.2%, a difference of 0.51%), Bahamian (2.2%, a difference of 0.51%), and South American Indian (2.2%, a difference of 0.70%).
| Demographics | Rating | Rank | No Schooling Completed |
| Immigrants | Ukraine | 26.1 /100 | #196 | Fair 2.2% |
| Immigrants | Southern Europe | 23.8 /100 | #197 | Fair 2.2% |
| Immigrants | Chile | 22.7 /100 | #198 | Fair 2.2% |
| Africans | 21.8 /100 | #199 | Fair 2.2% |
| Immigrants | Northern Africa | 19.5 /100 | #200 | Poor 2.2% |
| Costa Ricans | 17.1 /100 | #201 | Poor 2.2% |
| Moroccans | 13.7 /100 | #202 | Poor 2.2% |
| Laotians | 13.3 /100 | #203 | Poor 2.2% |
| Hopi | 12.9 /100 | #204 | Poor 2.2% |
| Immigrants | Bahamas | 11.6 /100 | #205 | Poor 2.2% |
| Bahamians | 11.6 /100 | #206 | Poor 2.2% |
| South American Indians | 11.0 /100 | #207 | Poor 2.2% |
| Uruguayans | 11.0 /100 | #208 | Poor 2.2% |
| Immigrants | Oceania | 10.2 /100 | #209 | Poor 2.2% |
| Natives/Alaskans | 10.0 /100 | #210 | Tragic 2.2% |