Slovak vs Dutch 10th Grade
COMPARE
Slovak
Dutch
10th Grade
10th Grade Comparison
Slovaks
Dutch
96.0%
10TH GRADE
100.0/ 100
METRIC RATING
2nd/ 347
METRIC RANK
95.5%
10TH GRADE
100.0/ 100
METRIC RATING
21st/ 347
METRIC RANK
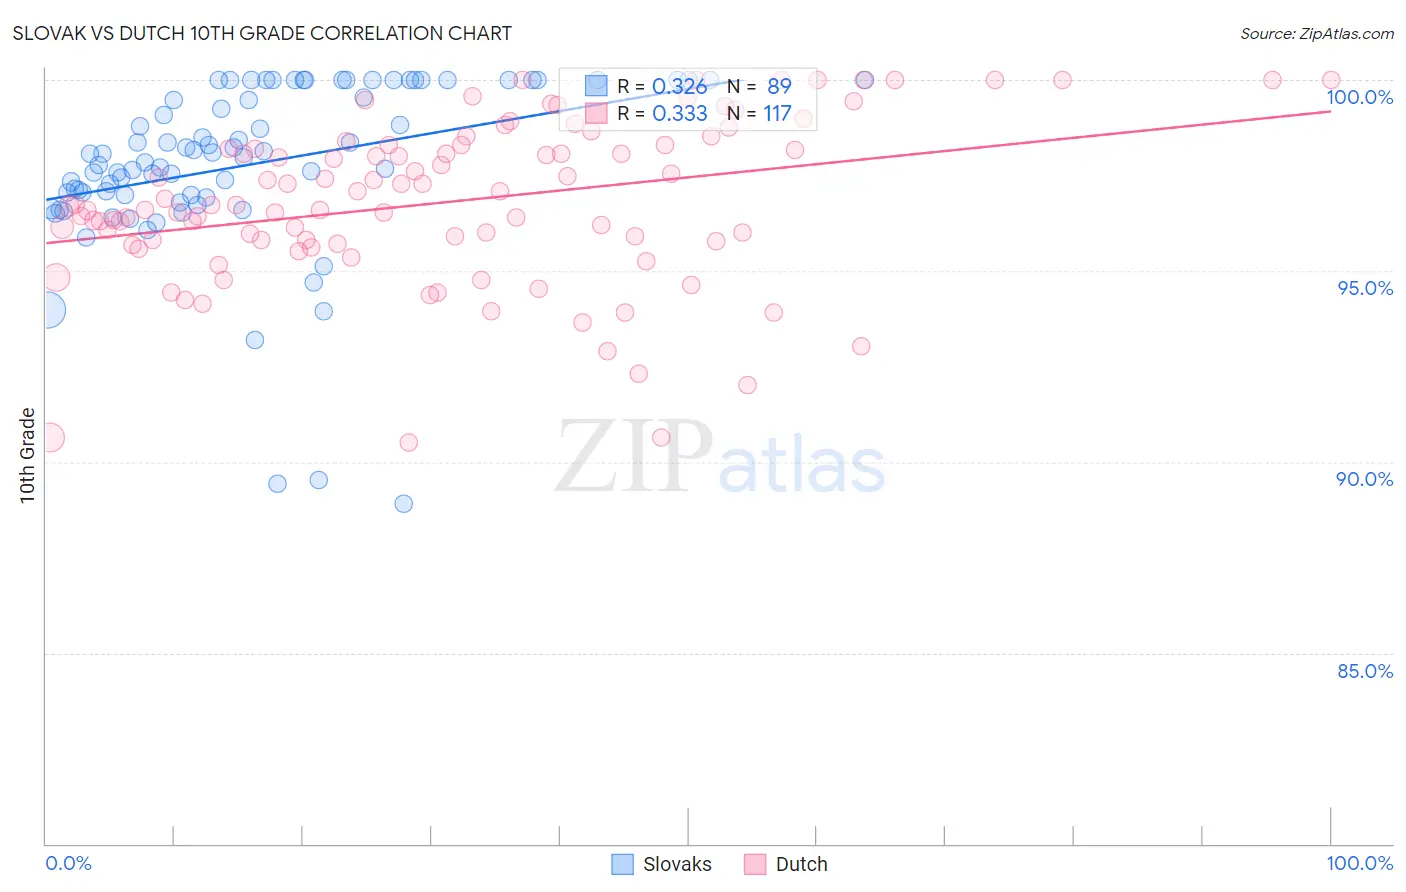
Slovak vs Dutch 10th Grade Correlation Chart
The statistical analysis conducted on geographies consisting of 397,891,887 people shows a mild positive correlation between the proportion of Slovaks and percentage of population with at least 10th grade education in the United States with a correlation coefficient (R) of 0.326 and weighted average of 96.0%. Similarly, the statistical analysis conducted on geographies consisting of 554,359,196 people shows a mild positive correlation between the proportion of Dutch and percentage of population with at least 10th grade education in the United States with a correlation coefficient (R) of 0.333 and weighted average of 95.5%, a difference of 0.54%.
10th Grade Correlation Summary
| Measurement | Slovak | Dutch |
| Minimum | 88.9% | 90.5% |
| Maximum | 100.0% | 100.0% |
| Range | 11.1% | 9.5% |
| Mean | 97.8% | 96.8% |
| Median | 98.1% | 96.7% |
| Interquartile 25% (IQ1) | 97.0% | 95.8% |
| Interquartile 75% (IQ3) | 100.0% | 98.3% |
| Interquartile Range (IQR) | 3.0% | 2.6% |
| Standard Deviation (Sample) | 2.3% | 2.1% |
| Standard Deviation (Population) | 2.2% | 2.1% |
Demographics Similar to Slovaks and Dutch by 10th Grade
In terms of 10th grade, the demographic groups most similar to Slovaks are Slovene (95.9%, a difference of 0.10%), Swedish (95.9%, a difference of 0.10%), Carpatho Rusyn (95.9%, a difference of 0.12%), Norwegian (96.2%, a difference of 0.13%), and Polish (95.8%, a difference of 0.23%). Similarly, the demographic groups most similar to Dutch are Chinese (95.5%, a difference of 0.010%), Italian (95.6%, a difference of 0.030%), Scandinavian (95.6%, a difference of 0.030%), Latvian (95.6%, a difference of 0.040%), and Scottish (95.6%, a difference of 0.050%).
| Demographics | Rating | Rank | 10th Grade |
| Norwegians | 100.0 /100 | #1 | Exceptional 96.2% |
| Slovaks | 100.0 /100 | #2 | Exceptional 96.0% |
| Slovenes | 100.0 /100 | #3 | Exceptional 95.9% |
| Swedes | 100.0 /100 | #4 | Exceptional 95.9% |
| Carpatho Rusyns | 100.0 /100 | #5 | Exceptional 95.9% |
| Poles | 100.0 /100 | #6 | Exceptional 95.8% |
| Germans | 100.0 /100 | #7 | Exceptional 95.8% |
| Lithuanians | 100.0 /100 | #8 | Exceptional 95.8% |
| Finns | 100.0 /100 | #9 | Exceptional 95.8% |
| Croatians | 100.0 /100 | #10 | Exceptional 95.7% |
| Danes | 100.0 /100 | #11 | Exceptional 95.7% |
| Tlingit-Haida | 100.0 /100 | #12 | Exceptional 95.7% |
| English | 100.0 /100 | #13 | Exceptional 95.6% |
| Tsimshian | 100.0 /100 | #14 | Exceptional 95.6% |
| Irish | 100.0 /100 | #15 | Exceptional 95.6% |
| Scottish | 100.0 /100 | #16 | Exceptional 95.6% |
| Latvians | 100.0 /100 | #17 | Exceptional 95.6% |
| Italians | 100.0 /100 | #18 | Exceptional 95.6% |
| Scandinavians | 100.0 /100 | #19 | Exceptional 95.6% |
| Chinese | 100.0 /100 | #20 | Exceptional 95.5% |
| Dutch | 100.0 /100 | #21 | Exceptional 95.5% |