Immigrants from Trinidad and Tobago vs Immigrants from Venezuela 5th Grade
COMPARE
Immigrants from Trinidad and Tobago
Immigrants from Venezuela
5th Grade
5th Grade Comparison
Immigrants from Trinidad and Tobago
Immigrants from Venezuela
96.6%
5TH GRADE
0.1/ 100
METRIC RATING
284th/ 347
METRIC RANK
97.3%
5TH GRADE
38.4/ 100
METRIC RATING
184th/ 347
METRIC RANK
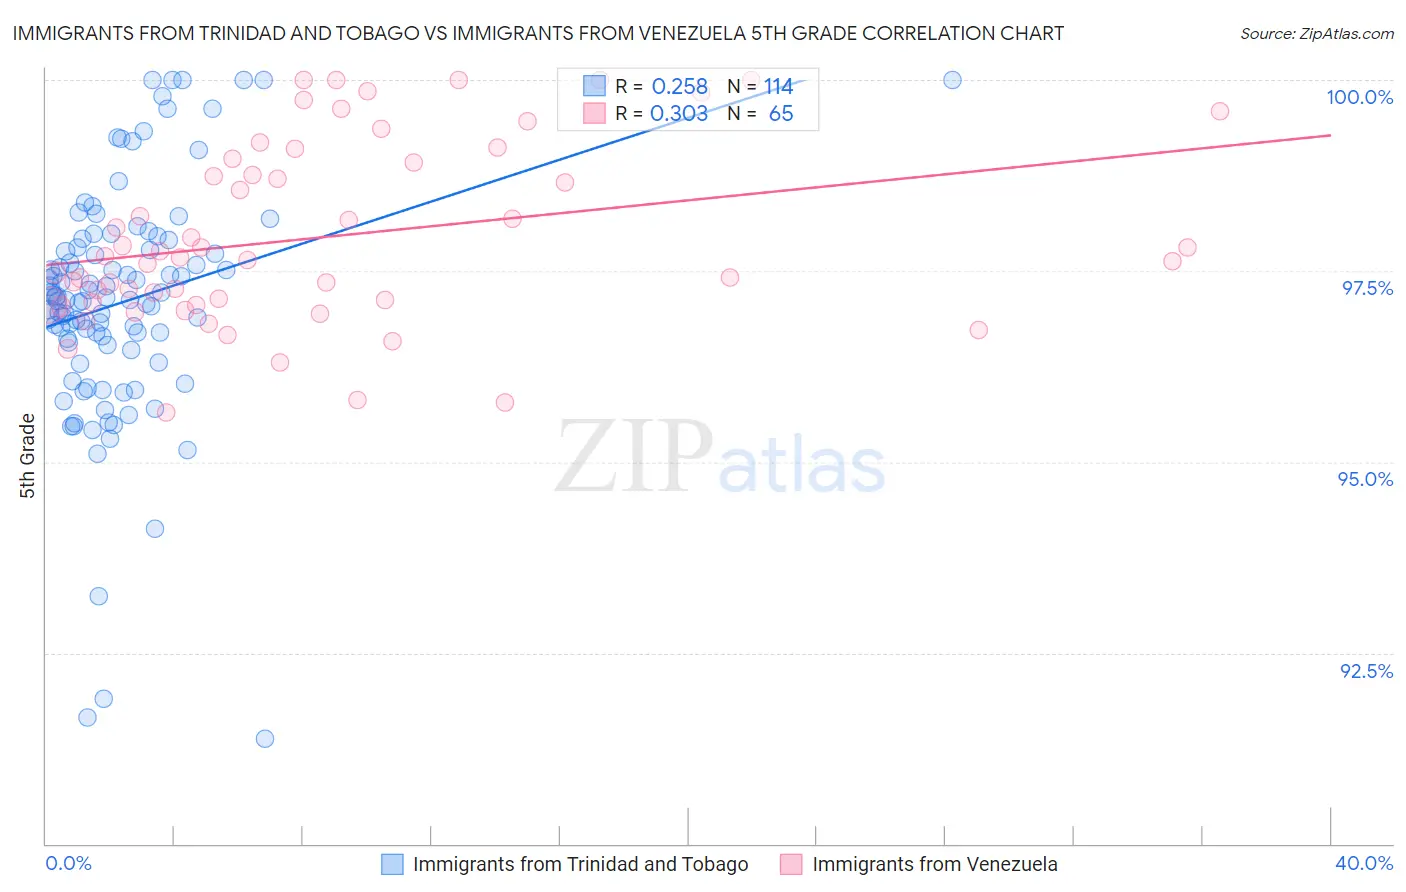
Immigrants from Trinidad and Tobago vs Immigrants from Venezuela 5th Grade Correlation Chart
The statistical analysis conducted on geographies consisting of 223,526,834 people shows a weak positive correlation between the proportion of Immigrants from Trinidad and Tobago and percentage of population with at least 5th grade education in the United States with a correlation coefficient (R) of 0.258 and weighted average of 96.6%. Similarly, the statistical analysis conducted on geographies consisting of 287,866,009 people shows a mild positive correlation between the proportion of Immigrants from Venezuela and percentage of population with at least 5th grade education in the United States with a correlation coefficient (R) of 0.303 and weighted average of 97.3%, a difference of 0.70%.
5th Grade Correlation Summary
| Measurement | Immigrants from Trinidad and Tobago | Immigrants from Venezuela |
| Minimum | 91.4% | 95.6% |
| Maximum | 100.0% | 100.0% |
| Range | 8.6% | 4.4% |
| Mean | 97.1% | 97.9% |
| Median | 97.1% | 97.7% |
| Interquartile 25% (IQ1) | 96.5% | 97.1% |
| Interquartile 75% (IQ3) | 97.8% | 99.0% |
| Interquartile Range (IQR) | 1.3% | 1.9% |
| Standard Deviation (Sample) | 1.6% | 1.2% |
| Standard Deviation (Population) | 1.6% | 1.2% |
Similar Demographics by 5th Grade
Demographics Similar to Immigrants from Trinidad and Tobago by 5th Grade
In terms of 5th grade, the demographic groups most similar to Immigrants from Trinidad and Tobago are Fijian (96.6%, a difference of 0.0%), Immigrants from Western Africa (96.6%, a difference of 0.010%), Houma (96.6%, a difference of 0.010%), Barbadian (96.6%, a difference of 0.010%), and Immigrants from St. Vincent and the Grenadines (96.6%, a difference of 0.010%).
| Demographics | Rating | Rank | 5th Grade |
| Immigrants | Bolivia | 0.1 /100 | #277 | Tragic 96.6% |
| Immigrants | Ghana | 0.1 /100 | #278 | Tragic 96.6% |
| Immigrants | Philippines | 0.1 /100 | #279 | Tragic 96.6% |
| Immigrants | Western Africa | 0.1 /100 | #280 | Tragic 96.6% |
| Houma | 0.1 /100 | #281 | Tragic 96.6% |
| Barbadians | 0.1 /100 | #282 | Tragic 96.6% |
| Fijians | 0.1 /100 | #283 | Tragic 96.6% |
| Immigrants | Trinidad and Tobago | 0.1 /100 | #284 | Tragic 96.6% |
| Immigrants | St. Vincent and the Grenadines | 0.1 /100 | #285 | Tragic 96.6% |
| Immigrants | Thailand | 0.1 /100 | #286 | Tragic 96.6% |
| Immigrants | Afghanistan | 0.1 /100 | #287 | Tragic 96.6% |
| Immigrants | Barbados | 0.0 /100 | #288 | Tragic 96.6% |
| Immigrants | West Indies | 0.0 /100 | #289 | Tragic 96.5% |
| British West Indians | 0.0 /100 | #290 | Tragic 96.5% |
| Malaysians | 0.0 /100 | #291 | Tragic 96.5% |
Demographics Similar to Immigrants from Venezuela by 5th Grade
In terms of 5th grade, the demographic groups most similar to Immigrants from Venezuela are Mongolian (97.3%, a difference of 0.0%), Immigrants from Ukraine (97.3%, a difference of 0.0%), Immigrants from Kenya (97.3%, a difference of 0.010%), Pakistani (97.3%, a difference of 0.010%), and Argentinean (97.3%, a difference of 0.010%).
| Demographics | Rating | Rank | 5th Grade |
| Immigrants | Spain | 47.0 /100 | #177 | Average 97.3% |
| Comanche | 42.1 /100 | #178 | Average 97.3% |
| Immigrants | Kenya | 40.3 /100 | #179 | Average 97.3% |
| Pakistanis | 40.2 /100 | #180 | Average 97.3% |
| Argentineans | 39.5 /100 | #181 | Fair 97.3% |
| Mongolians | 39.4 /100 | #182 | Fair 97.3% |
| Immigrants | Ukraine | 38.6 /100 | #183 | Fair 97.3% |
| Immigrants | Venezuela | 38.4 /100 | #184 | Fair 97.3% |
| Dutch West Indians | 36.2 /100 | #185 | Fair 97.3% |
| Immigrants | Argentina | 36.1 /100 | #186 | Fair 97.3% |
| Spanish Americans | 34.7 /100 | #187 | Fair 97.3% |
| Paraguayans | 33.7 /100 | #188 | Fair 97.3% |
| Immigrants | Egypt | 32.9 /100 | #189 | Fair 97.3% |
| Blacks/African Americans | 31.8 /100 | #190 | Fair 97.3% |
| Immigrants | Brazil | 31.5 /100 | #191 | Fair 97.3% |