Spanish American Indian vs Immigrants from Venezuela 5th Grade
COMPARE
Spanish American Indian
Immigrants from Venezuela
5th Grade
5th Grade Comparison
Spanish American Indians
Immigrants from Venezuela
94.2%
5TH GRADE
0.0/ 100
METRIC RATING
347th/ 347
METRIC RANK
97.3%
5TH GRADE
38.4/ 100
METRIC RATING
184th/ 347
METRIC RANK
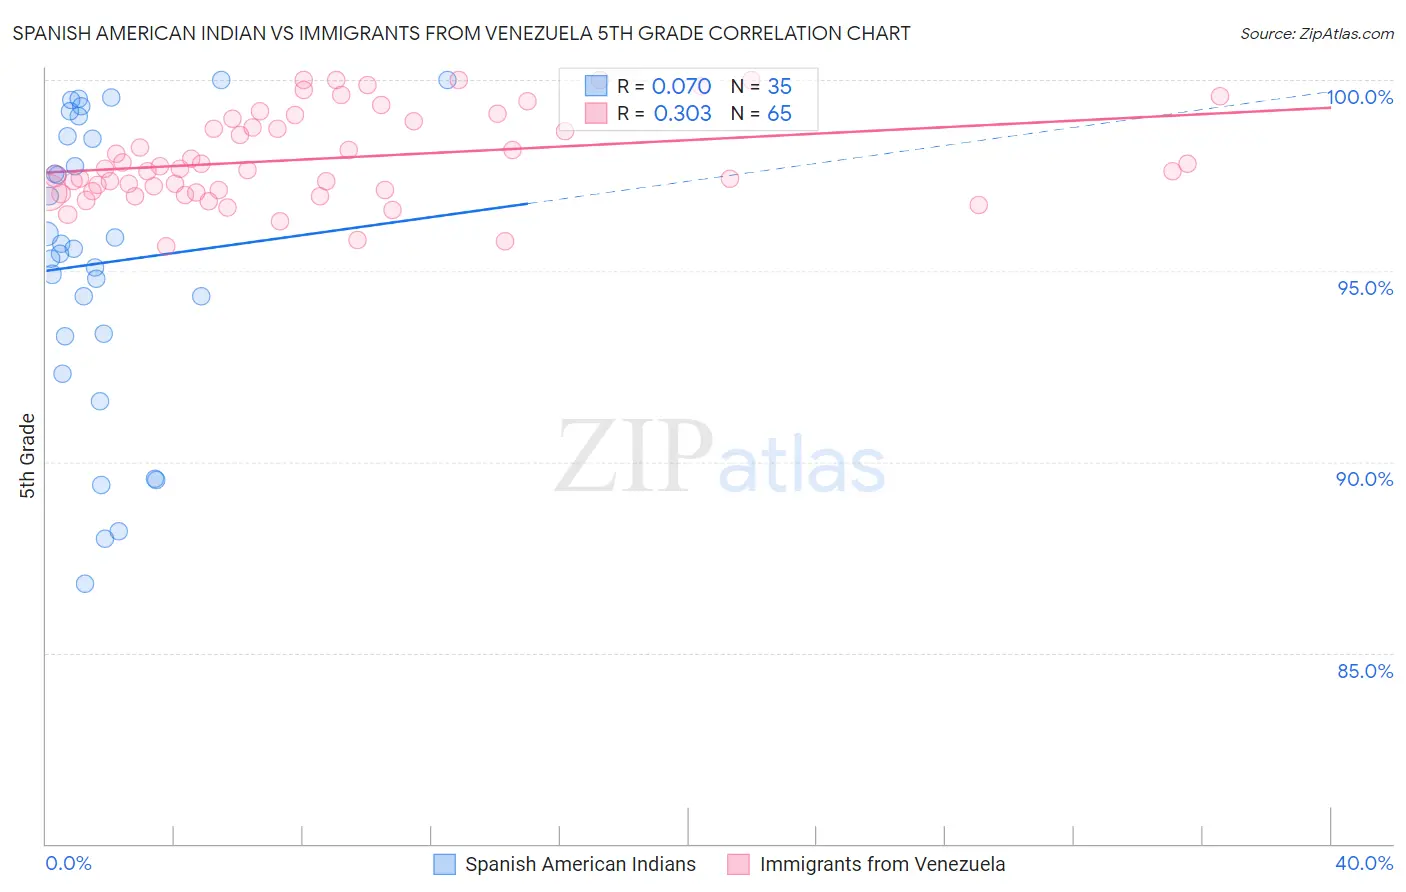
Spanish American Indian vs Immigrants from Venezuela 5th Grade Correlation Chart
The statistical analysis conducted on geographies consisting of 73,150,359 people shows a slight positive correlation between the proportion of Spanish American Indians and percentage of population with at least 5th grade education in the United States with a correlation coefficient (R) of 0.070 and weighted average of 94.2%. Similarly, the statistical analysis conducted on geographies consisting of 287,866,009 people shows a mild positive correlation between the proportion of Immigrants from Venezuela and percentage of population with at least 5th grade education in the United States with a correlation coefficient (R) of 0.303 and weighted average of 97.3%, a difference of 3.2%.
5th Grade Correlation Summary
| Measurement | Spanish American Indian | Immigrants from Venezuela |
| Minimum | 86.8% | 95.6% |
| Maximum | 100.0% | 100.0% |
| Range | 13.2% | 4.4% |
| Mean | 95.2% | 97.9% |
| Median | 95.6% | 97.7% |
| Interquartile 25% (IQ1) | 93.3% | 97.1% |
| Interquartile 75% (IQ3) | 98.5% | 99.0% |
| Interquartile Range (IQR) | 5.2% | 1.9% |
| Standard Deviation (Sample) | 3.8% | 1.2% |
| Standard Deviation (Population) | 3.8% | 1.2% |
Similar Demographics by 5th Grade
Demographics Similar to Spanish American Indians by 5th Grade
In terms of 5th grade, the demographic groups most similar to Spanish American Indians are Immigrants from El Salvador (94.3%, a difference of 0.11%), Salvadoran (94.6%, a difference of 0.40%), Immigrants from Mexico (94.6%, a difference of 0.40%), Immigrants from Guatemala (94.6%, a difference of 0.40%), and Immigrants from Central America (94.7%, a difference of 0.46%).
| Demographics | Rating | Rank | 5th Grade |
| Immigrants | Latin America | 0.0 /100 | #333 | Tragic 95.3% |
| Nepalese | 0.0 /100 | #334 | Tragic 95.2% |
| Mexicans | 0.0 /100 | #335 | Tragic 95.2% |
| Immigrants | Azores | 0.0 /100 | #336 | Tragic 95.1% |
| Central Americans | 0.0 /100 | #337 | Tragic 95.1% |
| Immigrants | Cabo Verde | 0.0 /100 | #338 | Tragic 94.9% |
| Immigrants | Yemen | 0.0 /100 | #339 | Tragic 94.9% |
| Guatemalans | 0.0 /100 | #340 | Tragic 94.8% |
| Yakama | 0.0 /100 | #341 | Tragic 94.8% |
| Immigrants | Central America | 0.0 /100 | #342 | Tragic 94.7% |
| Salvadorans | 0.0 /100 | #343 | Tragic 94.6% |
| Immigrants | Mexico | 0.0 /100 | #344 | Tragic 94.6% |
| Immigrants | Guatemala | 0.0 /100 | #345 | Tragic 94.6% |
| Immigrants | El Salvador | 0.0 /100 | #346 | Tragic 94.3% |
| Spanish American Indians | 0.0 /100 | #347 | Tragic 94.2% |
Demographics Similar to Immigrants from Venezuela by 5th Grade
In terms of 5th grade, the demographic groups most similar to Immigrants from Venezuela are Mongolian (97.3%, a difference of 0.0%), Immigrants from Ukraine (97.3%, a difference of 0.0%), Immigrants from Kenya (97.3%, a difference of 0.010%), Pakistani (97.3%, a difference of 0.010%), and Argentinean (97.3%, a difference of 0.010%).
| Demographics | Rating | Rank | 5th Grade |
| Immigrants | Spain | 47.0 /100 | #177 | Average 97.3% |
| Comanche | 42.1 /100 | #178 | Average 97.3% |
| Immigrants | Kenya | 40.3 /100 | #179 | Average 97.3% |
| Pakistanis | 40.2 /100 | #180 | Average 97.3% |
| Argentineans | 39.5 /100 | #181 | Fair 97.3% |
| Mongolians | 39.4 /100 | #182 | Fair 97.3% |
| Immigrants | Ukraine | 38.6 /100 | #183 | Fair 97.3% |
| Immigrants | Venezuela | 38.4 /100 | #184 | Fair 97.3% |
| Dutch West Indians | 36.2 /100 | #185 | Fair 97.3% |
| Immigrants | Argentina | 36.1 /100 | #186 | Fair 97.3% |
| Spanish Americans | 34.7 /100 | #187 | Fair 97.3% |
| Paraguayans | 33.7 /100 | #188 | Fair 97.3% |
| Immigrants | Egypt | 32.9 /100 | #189 | Fair 97.3% |
| Blacks/African Americans | 31.8 /100 | #190 | Fair 97.3% |
| Immigrants | Brazil | 31.5 /100 | #191 | Fair 97.3% |