Ugandan vs Immigrants from Cuba 6th Grade
COMPARE
Ugandan
Immigrants from Cuba
6th Grade
6th Grade Comparison
Ugandans
Immigrants from Cuba
97.1%
6TH GRADE
62.2/ 100
METRIC RATING
160th/ 347
METRIC RANK
95.6%
6TH GRADE
0.0/ 100
METRIC RATING
305th/ 347
METRIC RANK
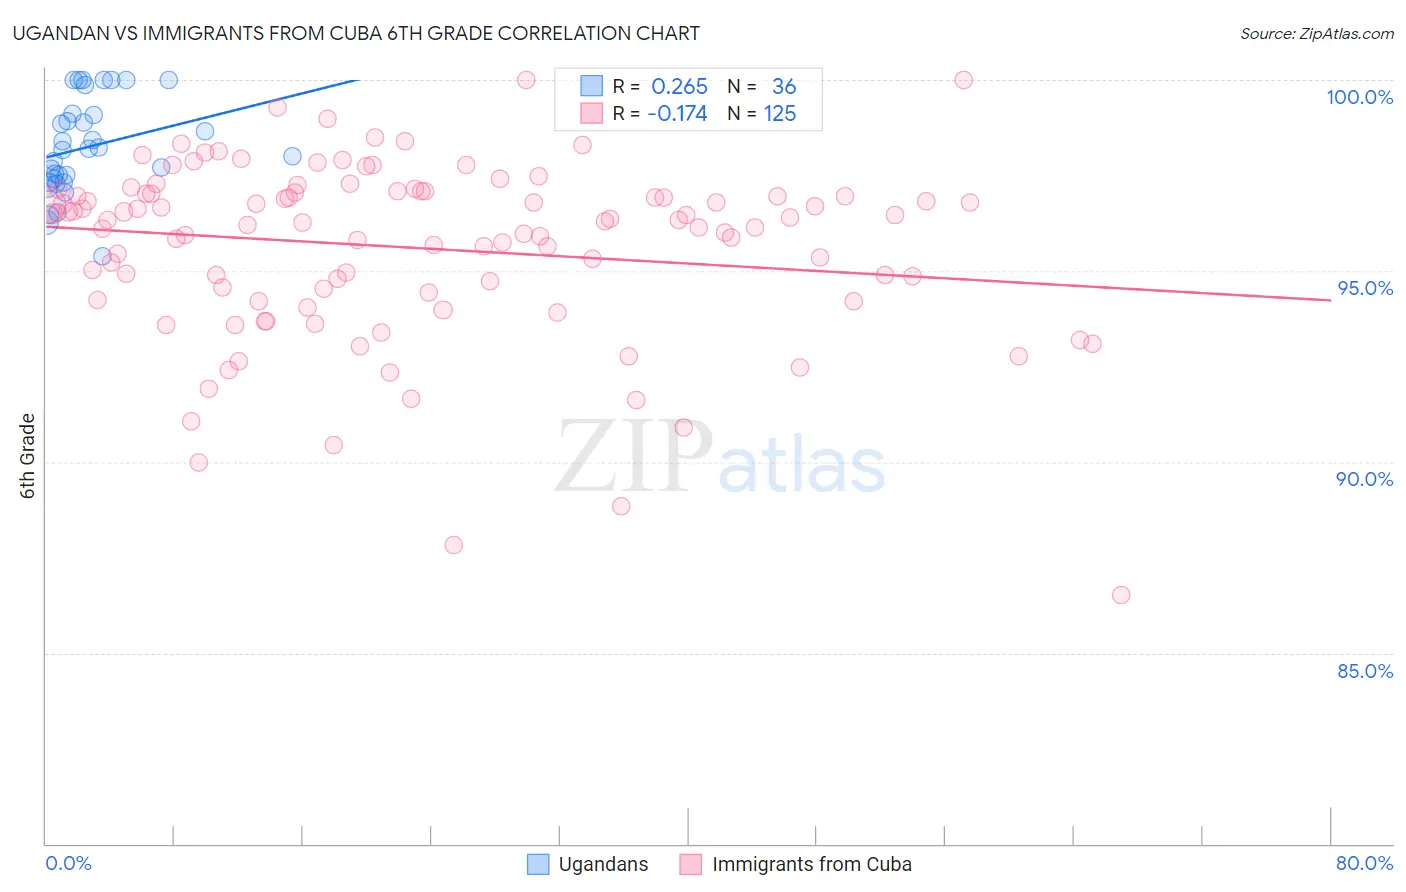
Ugandan vs Immigrants from Cuba 6th Grade Correlation Chart
The statistical analysis conducted on geographies consisting of 93,991,892 people shows a weak positive correlation between the proportion of Ugandans and percentage of population with at least 6th grade education in the United States with a correlation coefficient (R) of 0.265 and weighted average of 97.1%. Similarly, the statistical analysis conducted on geographies consisting of 326,028,159 people shows a poor negative correlation between the proportion of Immigrants from Cuba and percentage of population with at least 6th grade education in the United States with a correlation coefficient (R) of -0.174 and weighted average of 95.6%, a difference of 1.5%.
6th Grade Correlation Summary
| Measurement | Ugandan | Immigrants from Cuba |
| Minimum | 95.4% | 86.5% |
| Maximum | 100.0% | 100.0% |
| Range | 4.6% | 13.5% |
| Mean | 98.2% | 95.6% |
| Median | 98.2% | 96.3% |
| Interquartile 25% (IQ1) | 97.4% | 94.3% |
| Interquartile 75% (IQ3) | 99.1% | 97.0% |
| Interquartile Range (IQR) | 1.7% | 2.7% |
| Standard Deviation (Sample) | 1.2% | 2.3% |
| Standard Deviation (Population) | 1.2% | 2.3% |
Similar Demographics by 6th Grade
Demographics Similar to Ugandans by 6th Grade
In terms of 6th grade, the demographic groups most similar to Ugandans are Kenyan (97.1%, a difference of 0.0%), Immigrants from Iran (97.1%, a difference of 0.010%), Immigrants from Belarus (97.1%, a difference of 0.010%), Marshallese (97.1%, a difference of 0.010%), and Albanian (97.1%, a difference of 0.020%).
| Demographics | Rating | Rank | 6th Grade |
| Immigrants | Eastern Europe | 72.6 /100 | #153 | Good 97.2% |
| Soviet Union | 71.5 /100 | #154 | Good 97.2% |
| Ute | 71.1 /100 | #155 | Good 97.1% |
| Alsatians | 69.8 /100 | #156 | Good 97.1% |
| Immigrants | Russia | 67.6 /100 | #157 | Good 97.1% |
| Immigrants | Iran | 63.3 /100 | #158 | Good 97.1% |
| Kenyans | 62.9 /100 | #159 | Good 97.1% |
| Ugandans | 62.2 /100 | #160 | Good 97.1% |
| Immigrants | Belarus | 60.4 /100 | #161 | Good 97.1% |
| Marshallese | 60.2 /100 | #162 | Good 97.1% |
| Albanians | 57.8 /100 | #163 | Average 97.1% |
| Immigrants | Korea | 57.7 /100 | #164 | Average 97.1% |
| Immigrants | Poland | 56.2 /100 | #165 | Average 97.1% |
| Immigrants | Italy | 53.8 /100 | #166 | Average 97.1% |
| Apache | 53.6 /100 | #167 | Average 97.1% |
Demographics Similar to Immigrants from Cuba by 6th Grade
In terms of 6th grade, the demographic groups most similar to Immigrants from Cuba are Indonesian (95.6%, a difference of 0.020%), Bangladeshi (95.7%, a difference of 0.030%), Immigrants from Haiti (95.6%, a difference of 0.040%), Guyanese (95.6%, a difference of 0.060%), and Immigrants from Caribbean (95.6%, a difference of 0.070%).
| Demographics | Rating | Rank | 6th Grade |
| Sri Lankans | 0.0 /100 | #298 | Tragic 95.8% |
| Immigrants | Laos | 0.0 /100 | #299 | Tragic 95.7% |
| Immigrants | Dominica | 0.0 /100 | #300 | Tragic 95.7% |
| Immigrants | Immigrants | 0.0 /100 | #301 | Tragic 95.7% |
| Immigrants | Burma/Myanmar | 0.0 /100 | #302 | Tragic 95.7% |
| Bangladeshis | 0.0 /100 | #303 | Tragic 95.7% |
| Indonesians | 0.0 /100 | #304 | Tragic 95.6% |
| Immigrants | Cuba | 0.0 /100 | #305 | Tragic 95.6% |
| Immigrants | Haiti | 0.0 /100 | #306 | Tragic 95.6% |
| Guyanese | 0.0 /100 | #307 | Tragic 95.6% |
| Immigrants | Caribbean | 0.0 /100 | #308 | Tragic 95.6% |
| Puerto Ricans | 0.0 /100 | #309 | Tragic 95.5% |
| Ecuadorians | 0.0 /100 | #310 | Tragic 95.5% |
| Immigrants | Portugal | 0.0 /100 | #311 | Tragic 95.5% |
| Immigrants | Guyana | 0.0 /100 | #312 | Tragic 95.5% |