Immigrants from Senegal vs Zimbabwean 9th Grade
COMPARE
Immigrants from Senegal
Zimbabwean
9th Grade
9th Grade Comparison
Immigrants from Senegal
Zimbabweans
94.1%
9TH GRADE
0.9/ 100
METRIC RATING
252nd/ 347
METRIC RANK
95.9%
9TH GRADE
99.7/ 100
METRIC RATING
64th/ 347
METRIC RANK
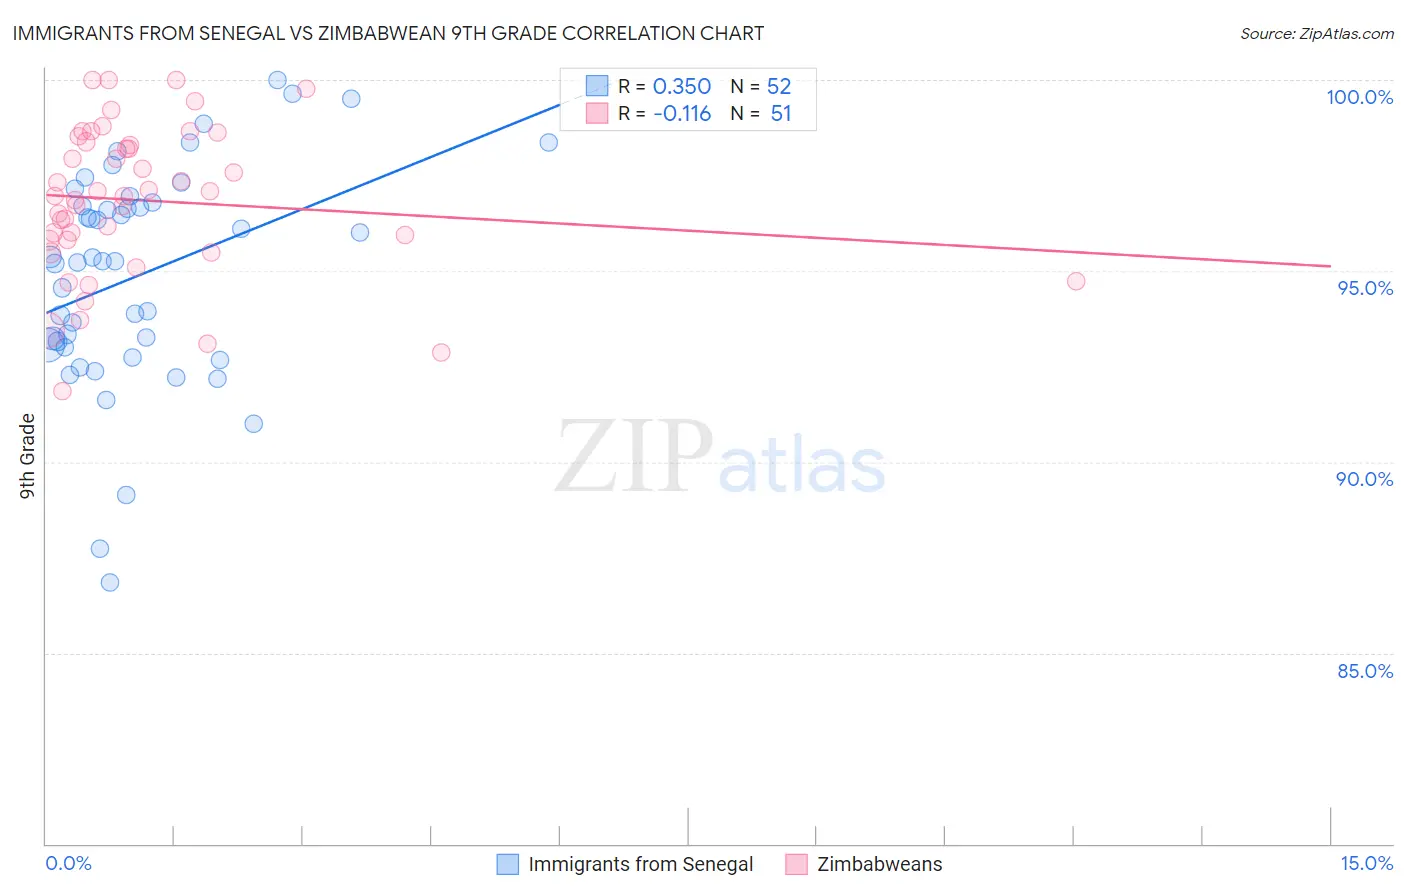
Immigrants from Senegal vs Zimbabwean 9th Grade Correlation Chart
The statistical analysis conducted on geographies consisting of 90,130,297 people shows a mild positive correlation between the proportion of Immigrants from Senegal and percentage of population with at least 9th grade education in the United States with a correlation coefficient (R) of 0.350 and weighted average of 94.1%. Similarly, the statistical analysis conducted on geographies consisting of 69,203,423 people shows a poor negative correlation between the proportion of Zimbabweans and percentage of population with at least 9th grade education in the United States with a correlation coefficient (R) of -0.116 and weighted average of 95.9%, a difference of 1.9%.
9th Grade Correlation Summary
| Measurement | Immigrants from Senegal | Zimbabwean |
| Minimum | 86.8% | 91.8% |
| Maximum | 100.0% | 100.0% |
| Range | 13.2% | 8.2% |
| Mean | 94.9% | 96.8% |
| Median | 95.3% | 97.0% |
| Interquartile 25% (IQ1) | 93.0% | 95.8% |
| Interquartile 75% (IQ3) | 96.8% | 98.4% |
| Interquartile Range (IQR) | 3.7% | 2.6% |
| Standard Deviation (Sample) | 2.9% | 2.0% |
| Standard Deviation (Population) | 2.8% | 1.9% |
Similar Demographics by 9th Grade
Demographics Similar to Immigrants from Senegal by 9th Grade
In terms of 9th grade, the demographic groups most similar to Immigrants from Senegal are Jamaican (94.1%, a difference of 0.010%), Colombian (94.0%, a difference of 0.020%), U.S. Virgin Islander (94.0%, a difference of 0.050%), Immigrants from Hong Kong (94.1%, a difference of 0.060%), and Uruguayan (94.1%, a difference of 0.070%).
| Demographics | Rating | Rank | 9th Grade |
| Paiute | 1.9 /100 | #245 | Tragic 94.2% |
| Senegalese | 1.9 /100 | #246 | Tragic 94.2% |
| Afghans | 1.8 /100 | #247 | Tragic 94.2% |
| Immigrants | Somalia | 1.4 /100 | #248 | Tragic 94.1% |
| Uruguayans | 1.3 /100 | #249 | Tragic 94.1% |
| Immigrants | Hong Kong | 1.3 /100 | #250 | Tragic 94.1% |
| Jamaicans | 1.0 /100 | #251 | Tragic 94.1% |
| Immigrants | Senegal | 0.9 /100 | #252 | Tragic 94.1% |
| Colombians | 0.8 /100 | #253 | Tragic 94.0% |
| U.S. Virgin Islanders | 0.7 /100 | #254 | Tragic 94.0% |
| Immigrants | Nigeria | 0.6 /100 | #255 | Tragic 94.0% |
| Immigrants | Afghanistan | 0.5 /100 | #256 | Tragic 94.0% |
| Immigrants | Costa Rica | 0.5 /100 | #257 | Tragic 94.0% |
| Immigrants | Thailand | 0.5 /100 | #258 | Tragic 93.9% |
| Ghanaians | 0.5 /100 | #259 | Tragic 93.9% |
Demographics Similar to Zimbabweans by 9th Grade
In terms of 9th grade, the demographic groups most similar to Zimbabweans are Canadian (95.9%, a difference of 0.010%), Immigrants from England (95.9%, a difference of 0.010%), Immigrants from Netherlands (95.8%, a difference of 0.030%), Cypriot (95.8%, a difference of 0.030%), and Immigrants from Ireland (95.8%, a difference of 0.040%).
| Demographics | Rating | Rank | 9th Grade |
| Macedonians | 99.8 /100 | #57 | Exceptional 96.0% |
| Aleuts | 99.8 /100 | #58 | Exceptional 96.0% |
| New Zealanders | 99.8 /100 | #59 | Exceptional 95.9% |
| Native Hawaiians | 99.8 /100 | #60 | Exceptional 95.9% |
| Sioux | 99.8 /100 | #61 | Exceptional 95.9% |
| Ukrainians | 99.7 /100 | #62 | Exceptional 95.9% |
| Canadians | 99.7 /100 | #63 | Exceptional 95.9% |
| Zimbabweans | 99.7 /100 | #64 | Exceptional 95.9% |
| Immigrants | England | 99.6 /100 | #65 | Exceptional 95.9% |
| Immigrants | Netherlands | 99.6 /100 | #66 | Exceptional 95.8% |
| Cypriots | 99.6 /100 | #67 | Exceptional 95.8% |
| Immigrants | Ireland | 99.6 /100 | #68 | Exceptional 95.8% |
| Immigrants | Lithuania | 99.6 /100 | #69 | Exceptional 95.8% |
| Immigrants | Australia | 99.5 /100 | #70 | Exceptional 95.8% |
| Immigrants | Belgium | 99.5 /100 | #71 | Exceptional 95.8% |