Immigrants from Turkey vs Zimbabwean 9th Grade
COMPARE
Immigrants from Turkey
Zimbabwean
9th Grade
9th Grade Comparison
Immigrants from Turkey
Zimbabweans
95.4%
9TH GRADE
95.6/ 100
METRIC RATING
118th/ 347
METRIC RANK
95.9%
9TH GRADE
99.7/ 100
METRIC RATING
64th/ 347
METRIC RANK
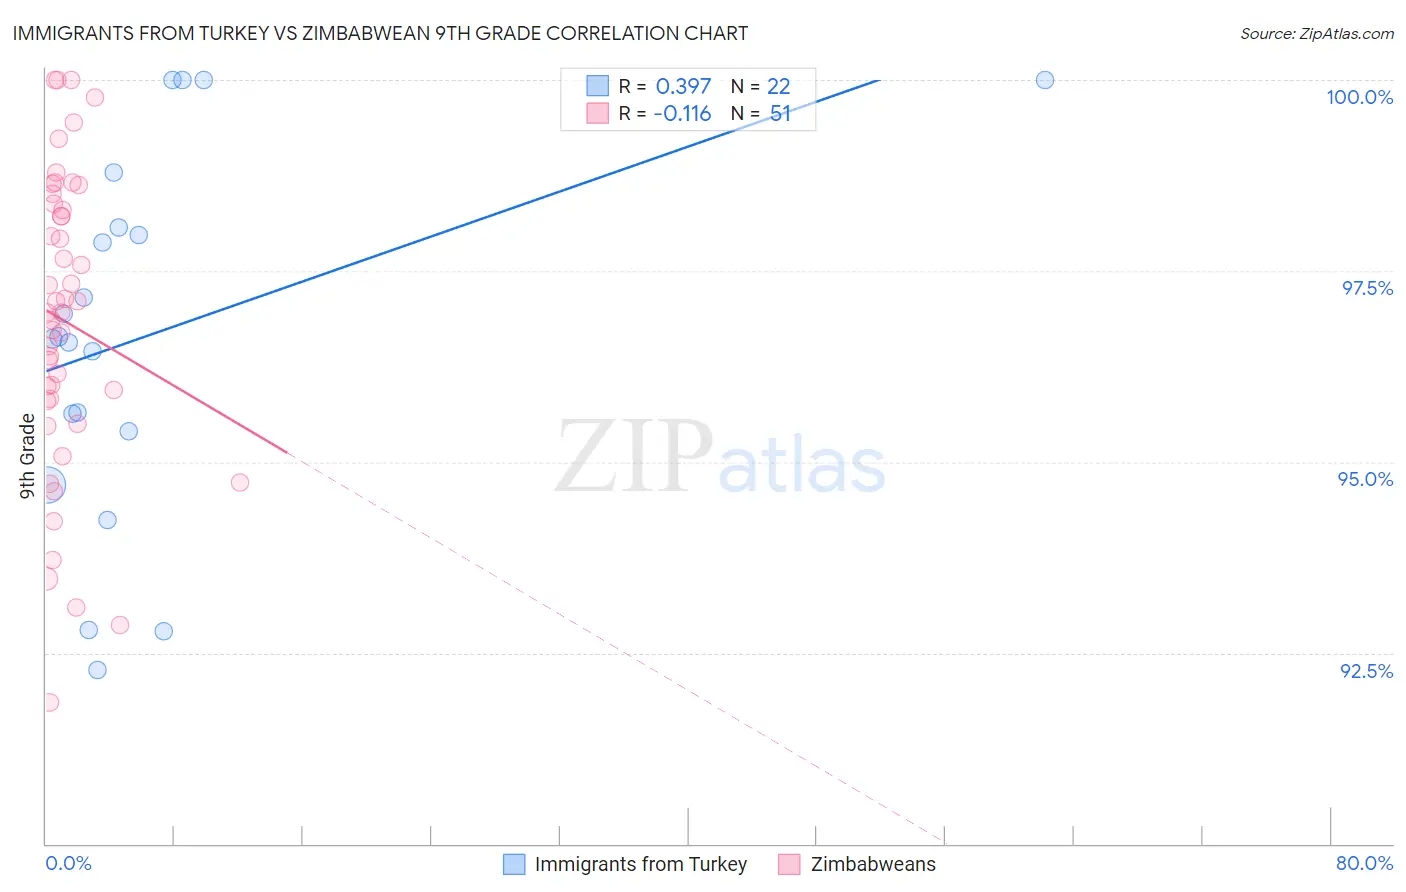
Immigrants from Turkey vs Zimbabwean 9th Grade Correlation Chart
The statistical analysis conducted on geographies consisting of 223,057,877 people shows a mild positive correlation between the proportion of Immigrants from Turkey and percentage of population with at least 9th grade education in the United States with a correlation coefficient (R) of 0.397 and weighted average of 95.4%. Similarly, the statistical analysis conducted on geographies consisting of 69,203,423 people shows a poor negative correlation between the proportion of Zimbabweans and percentage of population with at least 9th grade education in the United States with a correlation coefficient (R) of -0.116 and weighted average of 95.9%, a difference of 0.47%.
9th Grade Correlation Summary
| Measurement | Immigrants from Turkey | Zimbabwean |
| Minimum | 92.3% | 91.8% |
| Maximum | 100.0% | 100.0% |
| Range | 7.7% | 8.2% |
| Mean | 96.7% | 96.8% |
| Median | 96.6% | 97.0% |
| Interquartile 25% (IQ1) | 95.4% | 95.8% |
| Interquartile 75% (IQ3) | 98.1% | 98.4% |
| Interquartile Range (IQR) | 2.7% | 2.6% |
| Standard Deviation (Sample) | 2.4% | 2.0% |
| Standard Deviation (Population) | 2.3% | 1.9% |
Similar Demographics by 9th Grade
Demographics Similar to Immigrants from Turkey by 9th Grade
In terms of 9th grade, the demographic groups most similar to Immigrants from Turkey are Immigrants from Europe (95.4%, a difference of 0.0%), Immigrants from Romania (95.4%, a difference of 0.0%), Soviet Union (95.4%, a difference of 0.0%), Cambodian (95.4%, a difference of 0.0%), and Cree (95.4%, a difference of 0.0%).
| Demographics | Rating | Rank | 9th Grade |
| Cherokee | 96.3 /100 | #111 | Exceptional 95.4% |
| Immigrants | Croatia | 96.2 /100 | #112 | Exceptional 95.4% |
| Iroquois | 96.2 /100 | #113 | Exceptional 95.4% |
| German Russians | 96.1 /100 | #114 | Exceptional 95.4% |
| Burmese | 96.0 /100 | #115 | Exceptional 95.4% |
| Immigrants | Europe | 95.7 /100 | #116 | Exceptional 95.4% |
| Immigrants | Romania | 95.6 /100 | #117 | Exceptional 95.4% |
| Immigrants | Turkey | 95.6 /100 | #118 | Exceptional 95.4% |
| Soviet Union | 95.6 /100 | #119 | Exceptional 95.4% |
| Cambodians | 95.6 /100 | #120 | Exceptional 95.4% |
| Cree | 95.5 /100 | #121 | Exceptional 95.4% |
| Immigrants | Kuwait | 95.5 /100 | #122 | Exceptional 95.4% |
| Kiowa | 95.3 /100 | #123 | Exceptional 95.4% |
| Shoshone | 95.3 /100 | #124 | Exceptional 95.4% |
| Immigrants | South Central Asia | 95.1 /100 | #125 | Exceptional 95.4% |
Demographics Similar to Zimbabweans by 9th Grade
In terms of 9th grade, the demographic groups most similar to Zimbabweans are Canadian (95.9%, a difference of 0.010%), Immigrants from England (95.9%, a difference of 0.010%), Immigrants from Netherlands (95.8%, a difference of 0.030%), Cypriot (95.8%, a difference of 0.030%), and Immigrants from Ireland (95.8%, a difference of 0.040%).
| Demographics | Rating | Rank | 9th Grade |
| Macedonians | 99.8 /100 | #57 | Exceptional 96.0% |
| Aleuts | 99.8 /100 | #58 | Exceptional 96.0% |
| New Zealanders | 99.8 /100 | #59 | Exceptional 95.9% |
| Native Hawaiians | 99.8 /100 | #60 | Exceptional 95.9% |
| Sioux | 99.8 /100 | #61 | Exceptional 95.9% |
| Ukrainians | 99.7 /100 | #62 | Exceptional 95.9% |
| Canadians | 99.7 /100 | #63 | Exceptional 95.9% |
| Zimbabweans | 99.7 /100 | #64 | Exceptional 95.9% |
| Immigrants | England | 99.6 /100 | #65 | Exceptional 95.9% |
| Immigrants | Netherlands | 99.6 /100 | #66 | Exceptional 95.8% |
| Cypriots | 99.6 /100 | #67 | Exceptional 95.8% |
| Immigrants | Ireland | 99.6 /100 | #68 | Exceptional 95.8% |
| Immigrants | Lithuania | 99.6 /100 | #69 | Exceptional 95.8% |
| Immigrants | Australia | 99.5 /100 | #70 | Exceptional 95.8% |
| Immigrants | Belgium | 99.5 /100 | #71 | Exceptional 95.8% |