Immigrants from Western Europe vs Immigrants from Norway 11th Grade
COMPARE
Immigrants from Western Europe
Immigrants from Norway
11th Grade
11th Grade Comparison
Immigrants from Western Europe
Immigrants from Norway
93.6%
11TH GRADE
99.2/ 100
METRIC RATING
87th/ 347
METRIC RANK
93.5%
11TH GRADE
98.4/ 100
METRIC RATING
107th/ 347
METRIC RANK
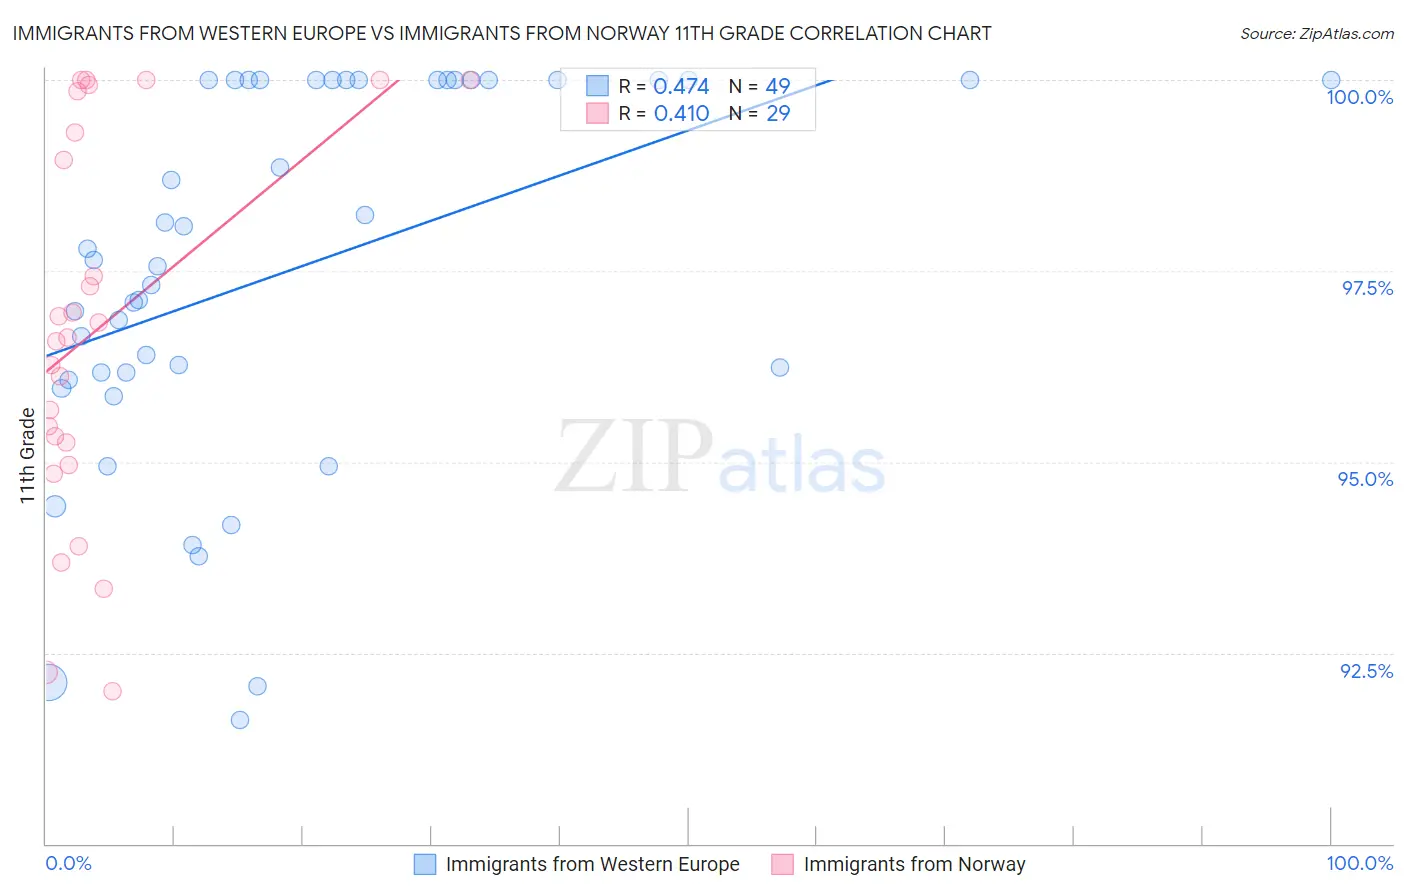
Immigrants from Western Europe vs Immigrants from Norway 11th Grade Correlation Chart
The statistical analysis conducted on geographies consisting of 494,080,378 people shows a moderate positive correlation between the proportion of Immigrants from Western Europe and percentage of population with at least 11th grade education in the United States with a correlation coefficient (R) of 0.474 and weighted average of 93.6%. Similarly, the statistical analysis conducted on geographies consisting of 116,716,420 people shows a moderate positive correlation between the proportion of Immigrants from Norway and percentage of population with at least 11th grade education in the United States with a correlation coefficient (R) of 0.410 and weighted average of 93.5%, a difference of 0.17%.
11th Grade Correlation Summary
| Measurement | Immigrants from Western Europe | Immigrants from Norway |
| Minimum | 91.6% | 92.0% |
| Maximum | 100.0% | 100.0% |
| Range | 8.4% | 8.0% |
| Mean | 97.5% | 96.8% |
| Median | 97.6% | 96.6% |
| Interquartile 25% (IQ1) | 96.1% | 95.1% |
| Interquartile 75% (IQ3) | 100.0% | 99.6% |
| Interquartile Range (IQR) | 3.9% | 4.5% |
| Standard Deviation (Sample) | 2.4% | 2.5% |
| Standard Deviation (Population) | 2.4% | 2.4% |
Demographics Similar to Immigrants from Western Europe and Immigrants from Norway by 11th Grade
In terms of 11th grade, the demographic groups most similar to Immigrants from Western Europe are Cambodian (93.6%, a difference of 0.0%), Burmese (93.6%, a difference of 0.0%), Ottawa (93.6%, a difference of 0.010%), South African (93.6%, a difference of 0.020%), and Immigrants from Bulgaria (93.6%, a difference of 0.030%). Similarly, the demographic groups most similar to Immigrants from Norway are Lebanese (93.5%, a difference of 0.020%), Immigrants from Europe (93.5%, a difference of 0.020%), Immigrants from Serbia (93.5%, a difference of 0.020%), Immigrants from Croatia (93.5%, a difference of 0.020%), and Chippewa (93.5%, a difference of 0.030%).
| Demographics | Rating | Rank | 11th Grade |
| Immigrants | Western Europe | 99.2 /100 | #87 | Exceptional 93.6% |
| Cambodians | 99.2 /100 | #88 | Exceptional 93.6% |
| Burmese | 99.2 /100 | #89 | Exceptional 93.6% |
| Ottawa | 99.2 /100 | #90 | Exceptional 93.6% |
| South Africans | 99.2 /100 | #91 | Exceptional 93.6% |
| Immigrants | Bulgaria | 99.1 /100 | #92 | Exceptional 93.6% |
| Puget Sound Salish | 99.1 /100 | #93 | Exceptional 93.6% |
| Swiss | 99.0 /100 | #94 | Exceptional 93.6% |
| Immigrants | France | 99.0 /100 | #95 | Exceptional 93.6% |
| Immigrants | Turkey | 98.9 /100 | #96 | Exceptional 93.5% |
| Immigrants | Iran | 98.9 /100 | #97 | Exceptional 93.5% |
| Immigrants | Israel | 98.8 /100 | #98 | Exceptional 93.5% |
| Menominee | 98.7 /100 | #99 | Exceptional 93.5% |
| Immigrants | North Macedonia | 98.7 /100 | #100 | Exceptional 93.5% |
| Immigrants | Romania | 98.7 /100 | #101 | Exceptional 93.5% |
| Chippewa | 98.6 /100 | #102 | Exceptional 93.5% |
| Lebanese | 98.6 /100 | #103 | Exceptional 93.5% |
| Immigrants | Europe | 98.6 /100 | #104 | Exceptional 93.5% |
| Immigrants | Serbia | 98.6 /100 | #105 | Exceptional 93.5% |
| Immigrants | Croatia | 98.6 /100 | #106 | Exceptional 93.5% |
| Immigrants | Norway | 98.4 /100 | #107 | Exceptional 93.5% |