Senegalese vs Immigrants from Chile Nursery School
COMPARE
Senegalese
Immigrants from Chile
Nursery School
Nursery School Comparison
Senegalese
Immigrants from Chile
97.7%
NURSERY SCHOOL
3.2/ 100
METRIC RATING
229th/ 347
METRIC RANK
97.9%
NURSERY SCHOOL
17.3/ 100
METRIC RATING
205th/ 347
METRIC RANK
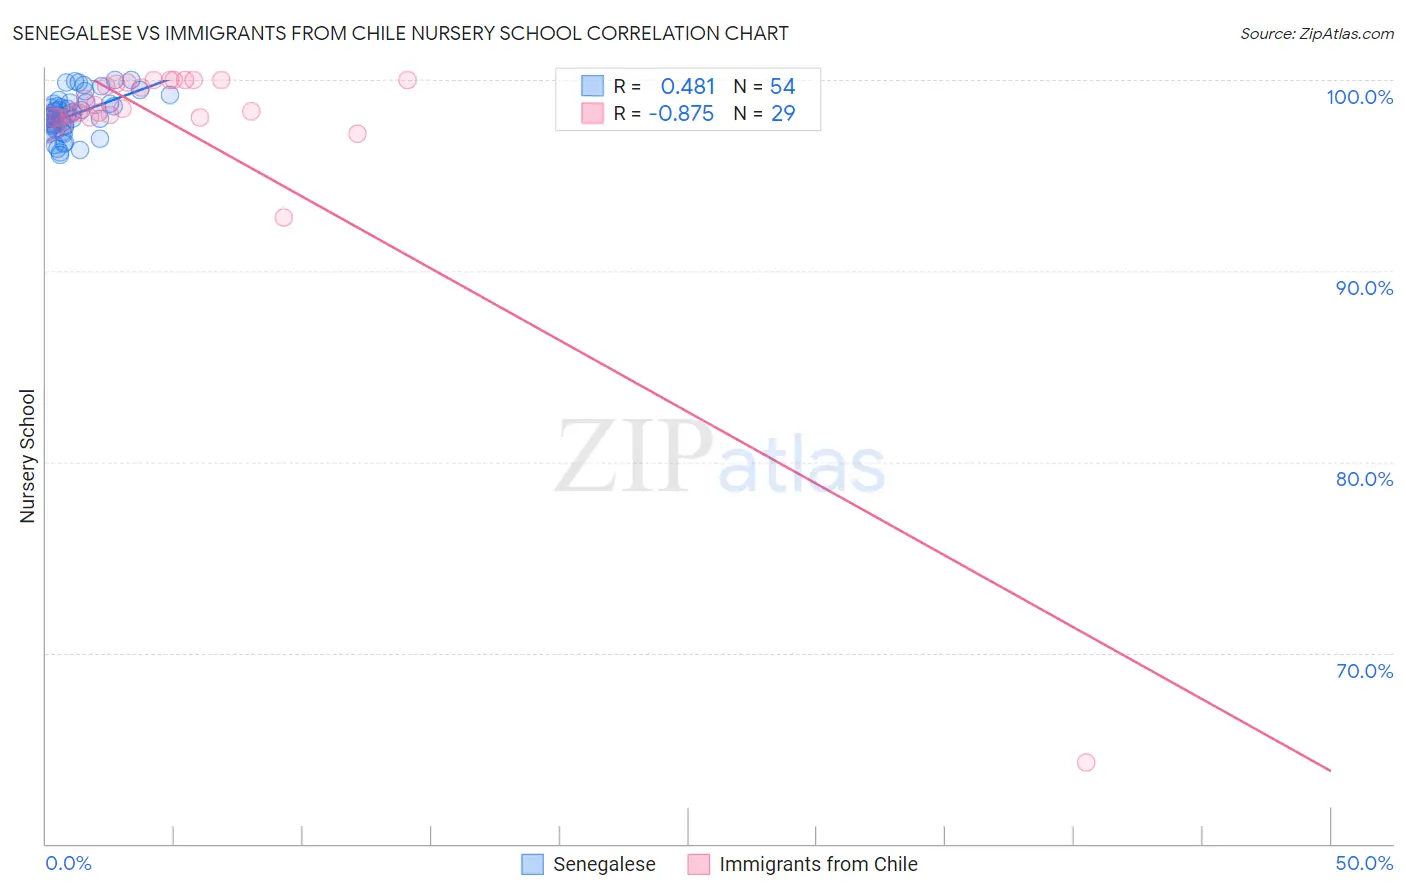
Senegalese vs Immigrants from Chile Nursery School Correlation Chart
The statistical analysis conducted on geographies consisting of 78,142,569 people shows a moderate positive correlation between the proportion of Senegalese and percentage of population with at least nursery school education in the United States with a correlation coefficient (R) of 0.481 and weighted average of 97.7%. Similarly, the statistical analysis conducted on geographies consisting of 218,647,266 people shows a very strong negative correlation between the proportion of Immigrants from Chile and percentage of population with at least nursery school education in the United States with a correlation coefficient (R) of -0.875 and weighted average of 97.9%, a difference of 0.14%.
Nursery School Correlation Summary
| Measurement | Senegalese | Immigrants from Chile |
| Minimum | 96.1% | 64.3% |
| Maximum | 100.0% | 100.0% |
| Range | 3.9% | 35.7% |
| Mean | 98.2% | 97.5% |
| Median | 98.1% | 98.4% |
| Interquartile 25% (IQ1) | 97.6% | 98.0% |
| Interquartile 75% (IQ3) | 98.8% | 99.9% |
| Interquartile Range (IQR) | 1.2% | 1.9% |
| Standard Deviation (Sample) | 1.0% | 6.5% |
| Standard Deviation (Population) | 1.0% | 6.4% |
Similar Demographics by Nursery School
Demographics Similar to Senegalese by Nursery School
In terms of nursery school, the demographic groups most similar to Senegalese are Subsaharan African (97.7%, a difference of 0.0%), Sudanese (97.7%, a difference of 0.0%), Immigrants from Nepal (97.7%, a difference of 0.010%), Immigrants from Costa Rica (97.7%, a difference of 0.010%), and Iraqi (97.7%, a difference of 0.010%).
| Demographics | Rating | Rank | Nursery School |
| Immigrants | Syria | 4.0 /100 | #222 | Tragic 97.7% |
| Immigrants | Sudan | 3.9 /100 | #223 | Tragic 97.7% |
| Immigrants | Nepal | 3.6 /100 | #224 | Tragic 97.7% |
| Immigrants | Costa Rica | 3.5 /100 | #225 | Tragic 97.7% |
| Iraqis | 3.5 /100 | #226 | Tragic 97.7% |
| Sub-Saharan Africans | 3.2 /100 | #227 | Tragic 97.7% |
| Sudanese | 3.2 /100 | #228 | Tragic 97.7% |
| Senegalese | 3.2 /100 | #229 | Tragic 97.7% |
| Sierra Leoneans | 2.9 /100 | #230 | Tragic 97.7% |
| Puerto Ricans | 2.6 /100 | #231 | Tragic 97.7% |
| Immigrants | Uruguay | 2.3 /100 | #232 | Tragic 97.7% |
| U.S. Virgin Islanders | 2.1 /100 | #233 | Tragic 97.7% |
| Colombians | 2.1 /100 | #234 | Tragic 97.7% |
| Immigrants | Pakistan | 2.1 /100 | #235 | Tragic 97.7% |
| Immigrants | Malaysia | 1.9 /100 | #236 | Tragic 97.7% |
Demographics Similar to Immigrants from Chile by Nursery School
In terms of nursery school, the demographic groups most similar to Immigrants from Chile are Immigrants from Uganda (97.9%, a difference of 0.0%), Immigrants from Southern Europe (97.9%, a difference of 0.0%), Immigrants from Albania (97.9%, a difference of 0.0%), Immigrants from Ukraine (97.9%, a difference of 0.010%), and African (97.9%, a difference of 0.010%).
| Demographics | Rating | Rank | Nursery School |
| Immigrants | Kenya | 24.1 /100 | #198 | Fair 97.9% |
| Immigrants | Egypt | 22.5 /100 | #199 | Fair 97.9% |
| Tohono O'odham | 22.2 /100 | #200 | Fair 97.9% |
| Immigrants | Lebanon | 21.2 /100 | #201 | Fair 97.9% |
| Immigrants | Ukraine | 19.9 /100 | #202 | Poor 97.9% |
| Immigrants | Uganda | 18.0 /100 | #203 | Poor 97.9% |
| Immigrants | Southern Europe | 17.4 /100 | #204 | Poor 97.9% |
| Immigrants | Chile | 17.3 /100 | #205 | Poor 97.9% |
| Immigrants | Albania | 16.4 /100 | #206 | Poor 97.9% |
| Africans | 15.4 /100 | #207 | Poor 97.9% |
| Immigrants | Northern Africa | 11.7 /100 | #208 | Poor 97.8% |
| Costa Ricans | 11.3 /100 | #209 | Poor 97.8% |
| Immigrants | Oceania | 10.2 /100 | #210 | Poor 97.8% |
| Laotians | 9.8 /100 | #211 | Tragic 97.8% |
| Immigrants | Bahamas | 8.6 /100 | #212 | Tragic 97.8% |