Bahamian vs Immigrants from Chile Nursery School
COMPARE
Bahamian
Immigrants from Chile
Nursery School
Nursery School Comparison
Bahamians
Immigrants from Chile
97.8%
NURSERY SCHOOL
7.4/ 100
METRIC RATING
215th/ 347
METRIC RANK
97.9%
NURSERY SCHOOL
17.3/ 100
METRIC RATING
205th/ 347
METRIC RANK
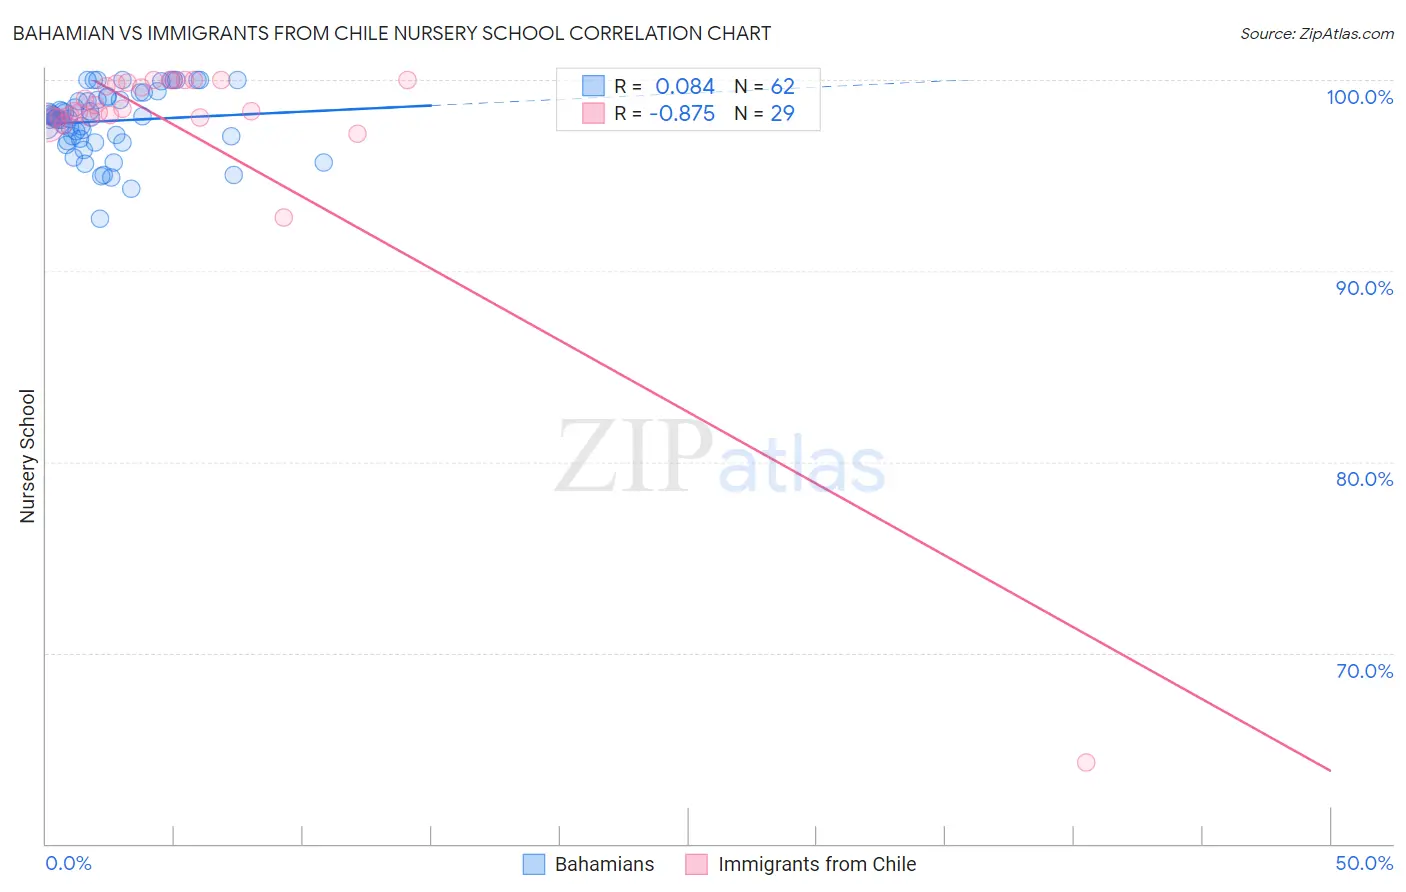
Bahamian vs Immigrants from Chile Nursery School Correlation Chart
The statistical analysis conducted on geographies consisting of 112,673,855 people shows a slight positive correlation between the proportion of Bahamians and percentage of population with at least nursery school education in the United States with a correlation coefficient (R) of 0.084 and weighted average of 97.8%. Similarly, the statistical analysis conducted on geographies consisting of 218,647,266 people shows a very strong negative correlation between the proportion of Immigrants from Chile and percentage of population with at least nursery school education in the United States with a correlation coefficient (R) of -0.875 and weighted average of 97.9%, a difference of 0.070%.
Nursery School Correlation Summary
| Measurement | Bahamian | Immigrants from Chile |
| Minimum | 92.7% | 64.3% |
| Maximum | 100.0% | 100.0% |
| Range | 7.3% | 35.7% |
| Mean | 97.9% | 97.5% |
| Median | 98.0% | 98.4% |
| Interquartile 25% (IQ1) | 96.9% | 98.0% |
| Interquartile 75% (IQ3) | 99.1% | 99.9% |
| Interquartile Range (IQR) | 2.2% | 1.9% |
| Standard Deviation (Sample) | 1.7% | 6.5% |
| Standard Deviation (Population) | 1.6% | 6.4% |
Demographics Similar to Bahamians and Immigrants from Chile by Nursery School
In terms of nursery school, the demographic groups most similar to Bahamians are Uruguayan (97.8%, a difference of 0.0%), Immigrants from Bahamas (97.8%, a difference of 0.010%), Moroccan (97.8%, a difference of 0.010%), South American Indian (97.8%, a difference of 0.010%), and Samoan (97.8%, a difference of 0.010%). Similarly, the demographic groups most similar to Immigrants from Chile are Immigrants from Uganda (97.9%, a difference of 0.0%), Immigrants from Southern Europe (97.9%, a difference of 0.0%), Immigrants from Albania (97.9%, a difference of 0.0%), Immigrants from Ukraine (97.9%, a difference of 0.010%), and African (97.9%, a difference of 0.010%).
| Demographics | Rating | Rank | Nursery School |
| Tohono O'odham | 22.2 /100 | #200 | Fair 97.9% |
| Immigrants | Lebanon | 21.2 /100 | #201 | Fair 97.9% |
| Immigrants | Ukraine | 19.9 /100 | #202 | Poor 97.9% |
| Immigrants | Uganda | 18.0 /100 | #203 | Poor 97.9% |
| Immigrants | Southern Europe | 17.4 /100 | #204 | Poor 97.9% |
| Immigrants | Chile | 17.3 /100 | #205 | Poor 97.9% |
| Immigrants | Albania | 16.4 /100 | #206 | Poor 97.9% |
| Africans | 15.4 /100 | #207 | Poor 97.9% |
| Immigrants | Northern Africa | 11.7 /100 | #208 | Poor 97.8% |
| Costa Ricans | 11.3 /100 | #209 | Poor 97.8% |
| Immigrants | Oceania | 10.2 /100 | #210 | Poor 97.8% |
| Laotians | 9.8 /100 | #211 | Tragic 97.8% |
| Immigrants | Bahamas | 8.6 /100 | #212 | Tragic 97.8% |
| Moroccans | 8.3 /100 | #213 | Tragic 97.8% |
| South American Indians | 8.0 /100 | #214 | Tragic 97.8% |
| Bahamians | 7.4 /100 | #215 | Tragic 97.8% |
| Uruguayans | 7.1 /100 | #216 | Tragic 97.8% |
| Samoans | 6.3 /100 | #217 | Tragic 97.8% |
| Immigrants | Panama | 5.3 /100 | #218 | Tragic 97.8% |
| Immigrants | Morocco | 5.1 /100 | #219 | Tragic 97.8% |
| Immigrants | Zaire | 4.4 /100 | #220 | Tragic 97.8% |