Hungarian vs Immigrants from Chile Nursery School
COMPARE
Hungarian
Immigrants from Chile
Nursery School
Nursery School Comparison
Hungarians
Immigrants from Chile
98.5%
NURSERY SCHOOL
99.9/ 100
METRIC RATING
46th/ 347
METRIC RANK
97.9%
NURSERY SCHOOL
17.3/ 100
METRIC RATING
205th/ 347
METRIC RANK
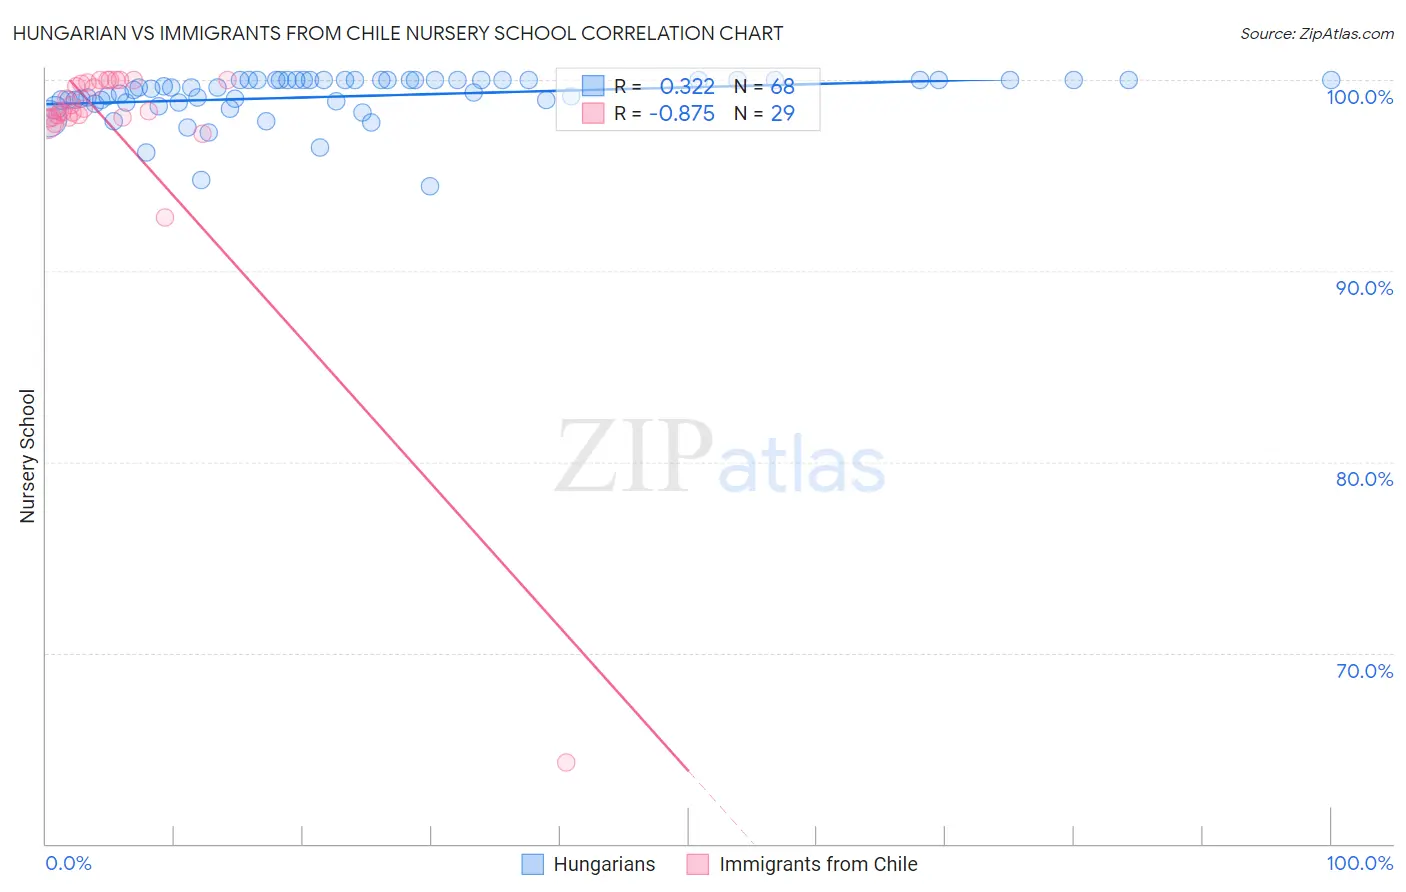
Hungarian vs Immigrants from Chile Nursery School Correlation Chart
The statistical analysis conducted on geographies consisting of 486,239,439 people shows a mild positive correlation between the proportion of Hungarians and percentage of population with at least nursery school education in the United States with a correlation coefficient (R) of 0.322 and weighted average of 98.5%. Similarly, the statistical analysis conducted on geographies consisting of 218,647,266 people shows a very strong negative correlation between the proportion of Immigrants from Chile and percentage of population with at least nursery school education in the United States with a correlation coefficient (R) of -0.875 and weighted average of 97.9%, a difference of 0.63%.
Nursery School Correlation Summary
| Measurement | Hungarian | Immigrants from Chile |
| Minimum | 94.4% | 64.3% |
| Maximum | 100.0% | 100.0% |
| Range | 5.6% | 35.7% |
| Mean | 99.2% | 97.5% |
| Median | 99.6% | 98.4% |
| Interquartile 25% (IQ1) | 98.9% | 98.0% |
| Interquartile 75% (IQ3) | 100.0% | 99.9% |
| Interquartile Range (IQR) | 1.1% | 1.9% |
| Standard Deviation (Sample) | 1.2% | 6.5% |
| Standard Deviation (Population) | 1.2% | 6.4% |
Similar Demographics by Nursery School
Demographics Similar to Hungarians by Nursery School
In terms of nursery school, the demographic groups most similar to Hungarians are Belgian (98.5%, a difference of 0.020%), Northern European (98.5%, a difference of 0.020%), Czechoslovakian (98.5%, a difference of 0.020%), Ottawa (98.5%, a difference of 0.020%), and Luxembourger (98.5%, a difference of 0.030%).
| Demographics | Rating | Rank | Nursery School |
| Latvians | 99.9 /100 | #39 | Exceptional 98.5% |
| Chippewa | 99.9 /100 | #40 | Exceptional 98.5% |
| Luxembourgers | 99.9 /100 | #41 | Exceptional 98.5% |
| Eastern Europeans | 99.9 /100 | #42 | Exceptional 98.5% |
| Native Hawaiians | 99.9 /100 | #43 | Exceptional 98.5% |
| Belgians | 99.9 /100 | #44 | Exceptional 98.5% |
| Northern Europeans | 99.9 /100 | #45 | Exceptional 98.5% |
| Hungarians | 99.9 /100 | #46 | Exceptional 98.5% |
| Czechoslovakians | 99.9 /100 | #47 | Exceptional 98.5% |
| Ottawa | 99.8 /100 | #48 | Exceptional 98.5% |
| Whites/Caucasians | 99.8 /100 | #49 | Exceptional 98.5% |
| Celtics | 99.8 /100 | #50 | Exceptional 98.5% |
| Estonians | 99.8 /100 | #51 | Exceptional 98.5% |
| Australians | 99.8 /100 | #52 | Exceptional 98.5% |
| Kiowa | 99.8 /100 | #53 | Exceptional 98.4% |
Demographics Similar to Immigrants from Chile by Nursery School
In terms of nursery school, the demographic groups most similar to Immigrants from Chile are Immigrants from Uganda (97.9%, a difference of 0.0%), Immigrants from Southern Europe (97.9%, a difference of 0.0%), Immigrants from Albania (97.9%, a difference of 0.0%), Immigrants from Ukraine (97.9%, a difference of 0.010%), and African (97.9%, a difference of 0.010%).
| Demographics | Rating | Rank | Nursery School |
| Immigrants | Kenya | 24.1 /100 | #198 | Fair 97.9% |
| Immigrants | Egypt | 22.5 /100 | #199 | Fair 97.9% |
| Tohono O'odham | 22.2 /100 | #200 | Fair 97.9% |
| Immigrants | Lebanon | 21.2 /100 | #201 | Fair 97.9% |
| Immigrants | Ukraine | 19.9 /100 | #202 | Poor 97.9% |
| Immigrants | Uganda | 18.0 /100 | #203 | Poor 97.9% |
| Immigrants | Southern Europe | 17.4 /100 | #204 | Poor 97.9% |
| Immigrants | Chile | 17.3 /100 | #205 | Poor 97.9% |
| Immigrants | Albania | 16.4 /100 | #206 | Poor 97.9% |
| Africans | 15.4 /100 | #207 | Poor 97.9% |
| Immigrants | Northern Africa | 11.7 /100 | #208 | Poor 97.8% |
| Costa Ricans | 11.3 /100 | #209 | Poor 97.8% |
| Immigrants | Oceania | 10.2 /100 | #210 | Poor 97.8% |
| Laotians | 9.8 /100 | #211 | Tragic 97.8% |
| Immigrants | Bahamas | 8.6 /100 | #212 | Tragic 97.8% |