Senegalese vs Immigrants from Korea 1st Grade
COMPARE
Senegalese
Immigrants from Korea
1st Grade
1st Grade Comparison
Senegalese
Immigrants from Korea
97.7%
1ST GRADE
3.5/ 100
METRIC RATING
230th/ 347
METRIC RANK
97.9%
1ST GRADE
53.0/ 100
METRIC RATING
172nd/ 347
METRIC RANK
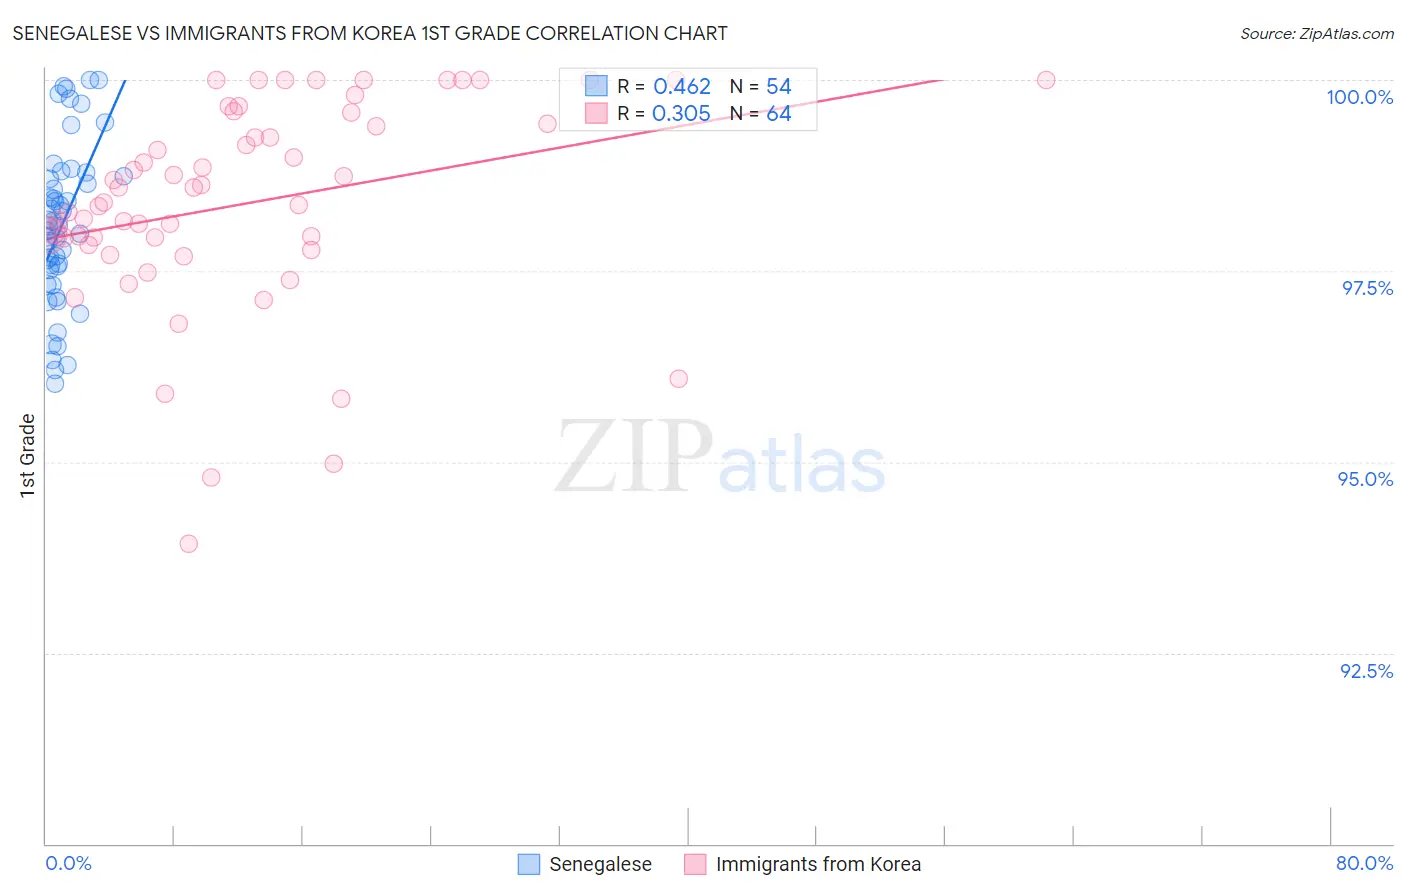
Senegalese vs Immigrants from Korea 1st Grade Correlation Chart
The statistical analysis conducted on geographies consisting of 78,142,569 people shows a moderate positive correlation between the proportion of Senegalese and percentage of population with at least 1st grade education in the United States with a correlation coefficient (R) of 0.462 and weighted average of 97.7%. Similarly, the statistical analysis conducted on geographies consisting of 416,280,076 people shows a mild positive correlation between the proportion of Immigrants from Korea and percentage of population with at least 1st grade education in the United States with a correlation coefficient (R) of 0.305 and weighted average of 97.9%, a difference of 0.27%.
1st Grade Correlation Summary
| Measurement | Senegalese | Immigrants from Korea |
| Minimum | 96.0% | 93.9% |
| Maximum | 100.0% | 100.0% |
| Range | 4.0% | 6.1% |
| Mean | 98.1% | 98.4% |
| Median | 98.1% | 98.5% |
| Interquartile 25% (IQ1) | 97.5% | 97.9% |
| Interquartile 75% (IQ3) | 98.7% | 99.5% |
| Interquartile Range (IQR) | 1.2% | 1.6% |
| Standard Deviation (Sample) | 1.0% | 1.4% |
| Standard Deviation (Population) | 1.0% | 1.4% |
Similar Demographics by 1st Grade
Demographics Similar to Senegalese by 1st Grade
In terms of 1st grade, the demographic groups most similar to Senegalese are Sierra Leonean (97.7%, a difference of 0.0%), Subsaharan African (97.7%, a difference of 0.0%), Immigrants from Costa Rica (97.7%, a difference of 0.0%), Immigrants from Zaire (97.7%, a difference of 0.010%), and Iraqi (97.7%, a difference of 0.010%).
| Demographics | Rating | Rank | 1st Grade |
| Immigrants | Zaire | 4.1 /100 | #223 | Tragic 97.7% |
| Iraqis | 4.0 /100 | #224 | Tragic 97.7% |
| Immigrants | Nepal | 4.0 /100 | #225 | Tragic 97.7% |
| Sudanese | 3.7 /100 | #226 | Tragic 97.7% |
| Sierra Leoneans | 3.6 /100 | #227 | Tragic 97.7% |
| Sub-Saharan Africans | 3.6 /100 | #228 | Tragic 97.7% |
| Immigrants | Costa Rica | 3.5 /100 | #229 | Tragic 97.7% |
| Senegalese | 3.5 /100 | #230 | Tragic 97.7% |
| Puerto Ricans | 3.0 /100 | #231 | Tragic 97.7% |
| Immigrants | Uruguay | 2.5 /100 | #232 | Tragic 97.6% |
| Immigrants | Pakistan | 2.2 /100 | #233 | Tragic 97.6% |
| Colombians | 2.2 /100 | #234 | Tragic 97.6% |
| Immigrants | Malaysia | 2.1 /100 | #235 | Tragic 97.6% |
| Immigrants | Western Asia | 2.1 /100 | #236 | Tragic 97.6% |
| U.S. Virgin Islanders | 1.9 /100 | #237 | Tragic 97.6% |
Demographics Similar to Immigrants from Korea by 1st Grade
In terms of 1st grade, the demographic groups most similar to Immigrants from Korea are Immigrants from Jordan (97.9%, a difference of 0.0%), Ugandan (97.9%, a difference of 0.010%), Navajo (97.9%, a difference of 0.010%), Bermudan (97.9%, a difference of 0.010%), and Chilean (97.9%, a difference of 0.010%).
| Demographics | Rating | Rank | 1st Grade |
| Ugandans | 56.9 /100 | #165 | Average 97.9% |
| Navajo | 56.6 /100 | #166 | Average 97.9% |
| Bermudans | 56.3 /100 | #167 | Average 97.9% |
| Chileans | 55.6 /100 | #168 | Average 97.9% |
| Immigrants | Micronesia | 55.3 /100 | #169 | Average 97.9% |
| Immigrants | Spain | 54.9 /100 | #170 | Average 97.9% |
| Immigrants | Jordan | 53.9 /100 | #171 | Average 97.9% |
| Immigrants | Korea | 53.0 /100 | #172 | Average 97.9% |
| Kenyans | 51.2 /100 | #173 | Average 97.9% |
| Natives/Alaskans | 50.0 /100 | #174 | Average 97.9% |
| Immigrants | Sri Lanka | 49.7 /100 | #175 | Average 97.9% |
| Albanians | 49.6 /100 | #176 | Average 97.9% |
| Immigrants | Brazil | 49.1 /100 | #177 | Average 97.9% |
| Immigrants | Venezuela | 47.8 /100 | #178 | Average 97.9% |
| Argentineans | 47.2 /100 | #179 | Average 97.9% |