Seminole vs Belgian Master's Degree
COMPARE
Seminole
Belgian
Master's Degree
Master's Degree Comparison
Seminole
Belgians
11.0%
MASTER'S DEGREE
0.0/ 100
METRIC RATING
311th/ 347
METRIC RANK
14.5%
MASTER'S DEGREE
28.0/ 100
METRIC RATING
197th/ 347
METRIC RANK
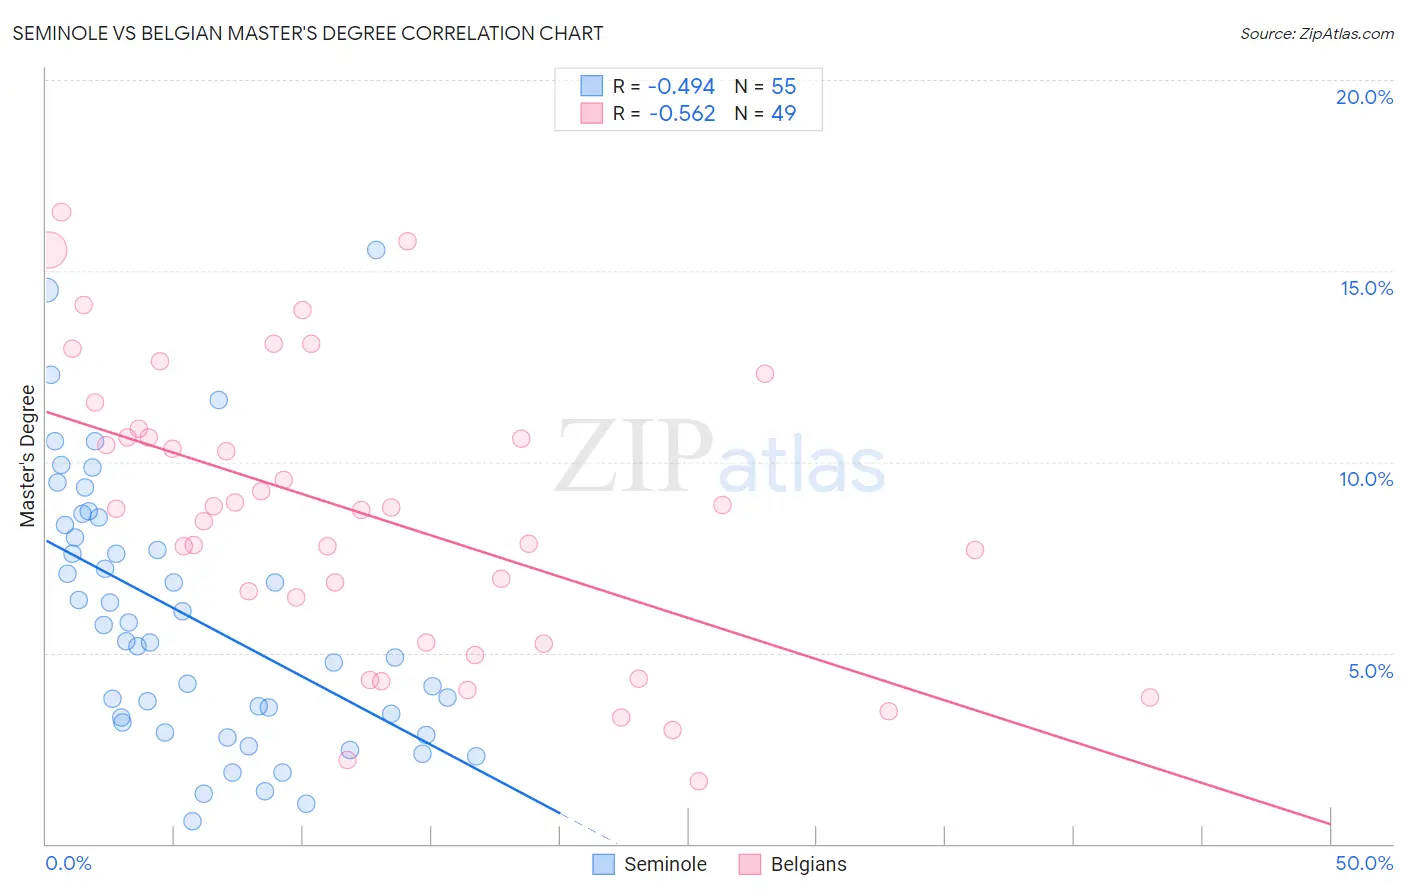
Seminole vs Belgian Master's Degree Correlation Chart
The statistical analysis conducted on geographies consisting of 118,305,652 people shows a moderate negative correlation between the proportion of Seminole and percentage of population with at least master's degree education in the United States with a correlation coefficient (R) of -0.494 and weighted average of 11.0%. Similarly, the statistical analysis conducted on geographies consisting of 355,911,624 people shows a substantial negative correlation between the proportion of Belgians and percentage of population with at least master's degree education in the United States with a correlation coefficient (R) of -0.562 and weighted average of 14.5%, a difference of 31.1%.
Master's Degree Correlation Summary
| Measurement | Seminole | Belgian |
| Minimum | 0.60% | 1.6% |
| Maximum | 15.6% | 16.5% |
| Range | 15.0% | 14.9% |
| Mean | 5.9% | 8.6% |
| Median | 5.3% | 8.8% |
| Interquartile 25% (IQ1) | 3.2% | 5.3% |
| Interquartile 75% (IQ3) | 8.4% | 10.7% |
| Interquartile Range (IQR) | 5.2% | 5.5% |
| Standard Deviation (Sample) | 3.5% | 3.8% |
| Standard Deviation (Population) | 3.4% | 3.7% |
Similar Demographics by Master's Degree
Demographics Similar to Seminole by Master's Degree
In terms of master's degree, the demographic groups most similar to Seminole are Choctaw (11.0%, a difference of 0.10%), Yaqui (11.0%, a difference of 0.27%), Shoshone (11.1%, a difference of 0.51%), Cajun (11.0%, a difference of 0.67%), and Apache (11.0%, a difference of 0.67%).
| Demographics | Rating | Rank | Master's Degree |
| Immigrants | Cabo Verde | 0.1 /100 | #304 | Tragic 11.3% |
| Immigrants | Latin America | 0.0 /100 | #305 | Tragic 11.3% |
| Mexican American Indians | 0.0 /100 | #306 | Tragic 11.2% |
| Cheyenne | 0.0 /100 | #307 | Tragic 11.2% |
| Puerto Ricans | 0.0 /100 | #308 | Tragic 11.2% |
| Puget Sound Salish | 0.0 /100 | #309 | Tragic 11.1% |
| Shoshone | 0.0 /100 | #310 | Tragic 11.1% |
| Seminole | 0.0 /100 | #311 | Tragic 11.0% |
| Choctaw | 0.0 /100 | #312 | Tragic 11.0% |
| Yaqui | 0.0 /100 | #313 | Tragic 11.0% |
| Cajuns | 0.0 /100 | #314 | Tragic 11.0% |
| Apache | 0.0 /100 | #315 | Tragic 11.0% |
| Hispanics or Latinos | 0.0 /100 | #316 | Tragic 10.9% |
| Hopi | 0.0 /100 | #317 | Tragic 10.9% |
| Immigrants | Cuba | 0.0 /100 | #318 | Tragic 10.9% |
Demographics Similar to Belgians by Master's Degree
In terms of master's degree, the demographic groups most similar to Belgians are West Indian (14.5%, a difference of 0.10%), Immigrants from Armenia (14.5%, a difference of 0.14%), Czechoslovakian (14.5%, a difference of 0.31%), Panamanian (14.4%, a difference of 0.50%), and Scotch-Irish (14.4%, a difference of 0.51%).
| Demographics | Rating | Rank | Master's Degree |
| Spaniards | 35.8 /100 | #190 | Fair 14.6% |
| Welsh | 34.2 /100 | #191 | Fair 14.6% |
| Immigrants | Middle Africa | 33.6 /100 | #192 | Fair 14.6% |
| Immigrants | Nigeria | 32.7 /100 | #193 | Fair 14.6% |
| Chinese | 32.5 /100 | #194 | Fair 14.6% |
| Danes | 31.3 /100 | #195 | Fair 14.5% |
| Czechoslovakians | 29.9 /100 | #196 | Fair 14.5% |
| Belgians | 28.0 /100 | #197 | Fair 14.5% |
| West Indians | 27.4 /100 | #198 | Fair 14.5% |
| Immigrants | Armenia | 27.2 /100 | #199 | Fair 14.5% |
| Panamanians | 25.1 /100 | #200 | Fair 14.4% |
| Scotch-Irish | 25.0 /100 | #201 | Fair 14.4% |
| Immigrants | Western Africa | 24.9 /100 | #202 | Fair 14.4% |
| Yugoslavians | 24.3 /100 | #203 | Fair 14.4% |
| French | 23.7 /100 | #204 | Fair 14.4% |