Immigrants from South Central Asia vs Alaskan Athabascan No Schooling Completed
COMPARE
Immigrants from South Central Asia
Alaskan Athabascan
No Schooling Completed
No Schooling Completed Comparison
Immigrants from South Central Asia
Alaskan Athabascans
2.0%
NO SCHOOLING COMPLETED
80.0/ 100
METRIC RATING
143rd/ 347
METRIC RANK
1.5%
NO SCHOOLING COMPLETED
100.0/ 100
METRIC RATING
19th/ 347
METRIC RANK
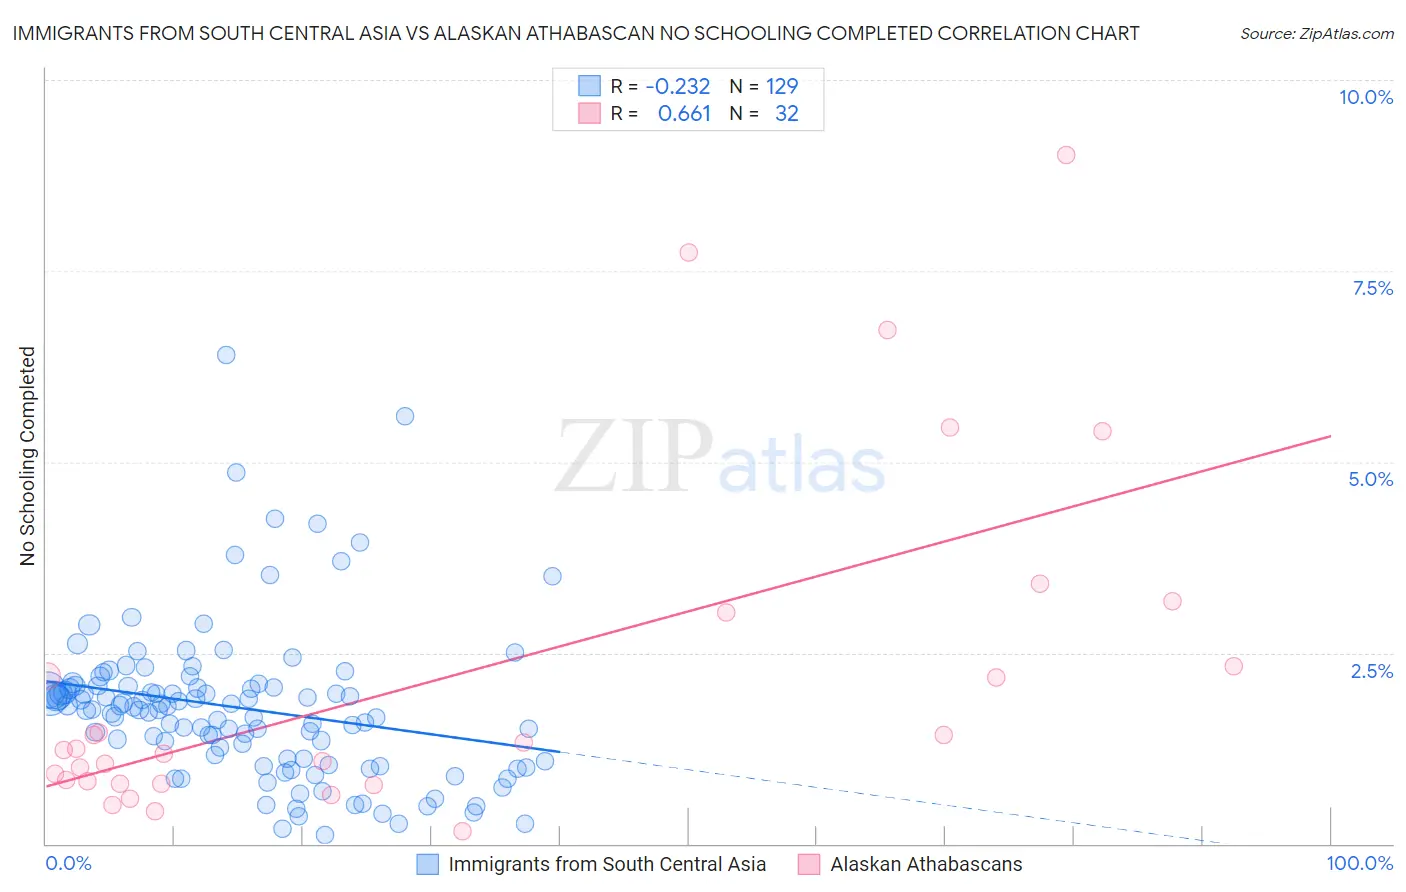
Immigrants from South Central Asia vs Alaskan Athabascan No Schooling Completed Correlation Chart
The statistical analysis conducted on geographies consisting of 466,715,377 people shows a weak negative correlation between the proportion of Immigrants from South Central Asia and percentage of population with no schooling in the United States with a correlation coefficient (R) of -0.232 and weighted average of 2.0%. Similarly, the statistical analysis conducted on geographies consisting of 45,557,234 people shows a significant positive correlation between the proportion of Alaskan Athabascans and percentage of population with no schooling in the United States with a correlation coefficient (R) of 0.661 and weighted average of 1.5%, a difference of 36.0%.
No Schooling Completed Correlation Summary
| Measurement | Immigrants from South Central Asia | Alaskan Athabascan |
| Minimum | 0.12% | 0.16% |
| Maximum | 6.4% | 9.0% |
| Range | 6.3% | 8.9% |
| Mean | 1.8% | 2.2% |
| Median | 1.8% | 1.2% |
| Interquartile 25% (IQ1) | 1.1% | 0.81% |
| Interquartile 75% (IQ3) | 2.1% | 2.7% |
| Interquartile Range (IQR) | 0.95% | 1.9% |
| Standard Deviation (Sample) | 1.0% | 2.3% |
| Standard Deviation (Population) | 1.0% | 2.2% |
Similar Demographics by No Schooling Completed
Demographics Similar to Immigrants from South Central Asia by No Schooling Completed
In terms of no schooling completed, the demographic groups most similar to Immigrants from South Central Asia are Alsatian (2.0%, a difference of 0.20%), Immigrants from Iran (2.0%, a difference of 0.21%), Venezuelan (2.0%, a difference of 0.35%), Immigrants from Moldova (2.0%, a difference of 0.42%), and Soviet Union (2.0%, a difference of 0.60%).
| Demographics | Rating | Rank | No Schooling Completed |
| Burmese | 88.2 /100 | #136 | Excellent 1.9% |
| Filipinos | 85.5 /100 | #137 | Excellent 2.0% |
| Immigrants | Israel | 85.4 /100 | #138 | Excellent 2.0% |
| Jordanians | 84.5 /100 | #139 | Excellent 2.0% |
| Marshallese | 83.5 /100 | #140 | Excellent 2.0% |
| Immigrants | Greece | 83.5 /100 | #141 | Excellent 2.0% |
| Venezuelans | 81.5 /100 | #142 | Excellent 2.0% |
| Immigrants | South Central Asia | 80.0 /100 | #143 | Good 2.0% |
| Alsatians | 79.1 /100 | #144 | Good 2.0% |
| Immigrants | Iran | 79.0 /100 | #145 | Good 2.0% |
| Immigrants | Moldova | 78.0 /100 | #146 | Good 2.0% |
| Soviet Union | 77.1 /100 | #147 | Good 2.0% |
| Shoshone | 76.7 /100 | #148 | Good 2.0% |
| Immigrants | North Macedonia | 75.9 /100 | #149 | Good 2.0% |
| Blackfeet | 72.9 /100 | #150 | Good 2.0% |
Demographics Similar to Alaskan Athabascans by No Schooling Completed
In terms of no schooling completed, the demographic groups most similar to Alaskan Athabascans are Danish (1.5%, a difference of 0.10%), Welsh (1.5%, a difference of 0.13%), Croatian (1.5%, a difference of 0.41%), Finnish (1.5%, a difference of 0.42%), and Chinese (1.5%, a difference of 0.49%).
| Demographics | Rating | Rank | No Schooling Completed |
| Irish | 100.0 /100 | #12 | Exceptional 1.4% |
| Poles | 100.0 /100 | #13 | Exceptional 1.4% |
| Scotch-Irish | 100.0 /100 | #14 | Exceptional 1.5% |
| Tlingit-Haida | 100.0 /100 | #15 | Exceptional 1.5% |
| Finns | 100.0 /100 | #16 | Exceptional 1.5% |
| Croatians | 100.0 /100 | #17 | Exceptional 1.5% |
| Danes | 100.0 /100 | #18 | Exceptional 1.5% |
| Alaskan Athabascans | 100.0 /100 | #19 | Exceptional 1.5% |
| Welsh | 100.0 /100 | #20 | Exceptional 1.5% |
| Chinese | 100.0 /100 | #21 | Exceptional 1.5% |
| Alaska Natives | 100.0 /100 | #22 | Exceptional 1.5% |
| Europeans | 100.0 /100 | #23 | Exceptional 1.5% |
| Pennsylvania Germans | 100.0 /100 | #24 | Exceptional 1.5% |
| French | 100.0 /100 | #25 | Exceptional 1.5% |
| Czechs | 100.0 /100 | #26 | Exceptional 1.5% |