Immigrants from Uzbekistan vs Slavic Bachelor's Degree
COMPARE
Immigrants from Uzbekistan
Slavic
Bachelor's Degree
Bachelor's Degree Comparison
Immigrants from Uzbekistan
Slavs
42.8%
BACHELOR'S DEGREE
99.5/ 100
METRIC RATING
73rd/ 347
METRIC RANK
38.9%
BACHELOR'S DEGREE
75.9/ 100
METRIC RATING
153rd/ 347
METRIC RANK
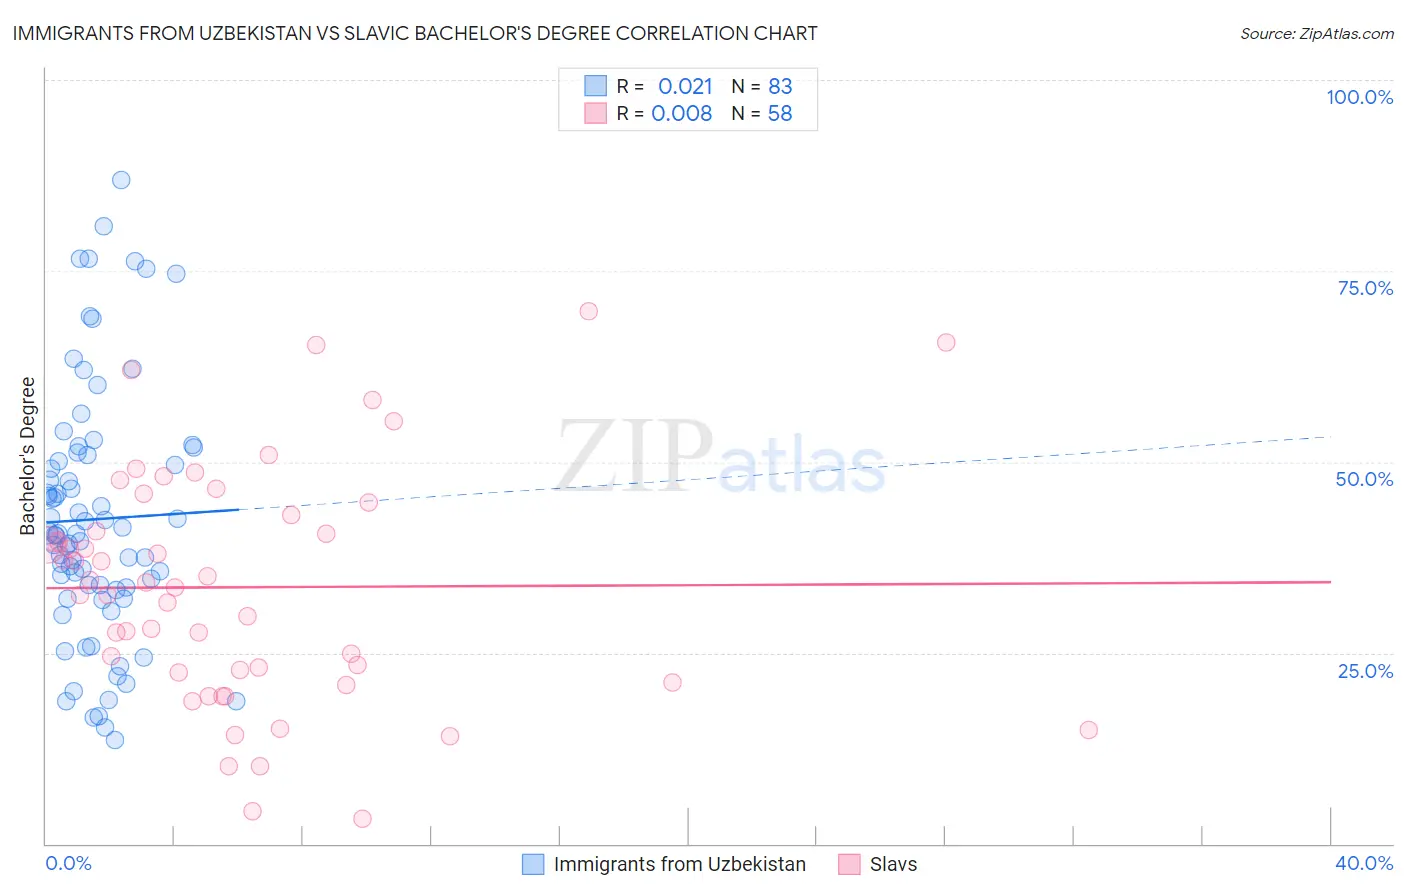
Immigrants from Uzbekistan vs Slavic Bachelor's Degree Correlation Chart
The statistical analysis conducted on geographies consisting of 118,752,495 people shows no correlation between the proportion of Immigrants from Uzbekistan and percentage of population with at least bachelor's degree education in the United States with a correlation coefficient (R) of 0.021 and weighted average of 42.8%. Similarly, the statistical analysis conducted on geographies consisting of 270,854,926 people shows no correlation between the proportion of Slavs and percentage of population with at least bachelor's degree education in the United States with a correlation coefficient (R) of 0.008 and weighted average of 38.9%, a difference of 10.0%.
Bachelor's Degree Correlation Summary
| Measurement | Immigrants from Uzbekistan | Slavic |
| Minimum | 13.6% | 3.3% |
| Maximum | 86.9% | 69.8% |
| Range | 73.3% | 66.4% |
| Mean | 42.5% | 33.6% |
| Median | 40.5% | 33.9% |
| Interquartile 25% (IQ1) | 33.2% | 22.4% |
| Interquartile 75% (IQ3) | 50.9% | 43.0% |
| Interquartile Range (IQR) | 17.6% | 20.7% |
| Standard Deviation (Sample) | 16.4% | 15.4% |
| Standard Deviation (Population) | 16.3% | 15.3% |
Similar Demographics by Bachelor's Degree
Demographics Similar to Immigrants from Uzbekistan by Bachelor's Degree
In terms of bachelor's degree, the demographic groups most similar to Immigrants from Uzbekistan are Ethiopian (42.8%, a difference of 0.050%), Immigrants from Argentina (42.8%, a difference of 0.14%), Bhutanese (42.7%, a difference of 0.22%), Immigrants from Romania (42.9%, a difference of 0.40%), and Immigrants from Zimbabwe (42.6%, a difference of 0.44%).
| Demographics | Rating | Rank | Bachelor's Degree |
| Immigrants | Netherlands | 99.7 /100 | #66 | Exceptional 43.3% |
| Egyptians | 99.7 /100 | #67 | Exceptional 43.3% |
| Immigrants | Indonesia | 99.7 /100 | #68 | Exceptional 43.3% |
| Immigrants | Pakistan | 99.7 /100 | #69 | Exceptional 43.1% |
| Immigrants | Romania | 99.6 /100 | #70 | Exceptional 42.9% |
| Immigrants | Argentina | 99.6 /100 | #71 | Exceptional 42.8% |
| Ethiopians | 99.5 /100 | #72 | Exceptional 42.8% |
| Immigrants | Uzbekistan | 99.5 /100 | #73 | Exceptional 42.8% |
| Bhutanese | 99.5 /100 | #74 | Exceptional 42.7% |
| Immigrants | Zimbabwe | 99.4 /100 | #75 | Exceptional 42.6% |
| Immigrants | Egypt | 99.4 /100 | #76 | Exceptional 42.6% |
| Immigrants | Eastern Europe | 99.4 /100 | #77 | Exceptional 42.5% |
| Immigrants | Ethiopia | 99.4 /100 | #78 | Exceptional 42.5% |
| Immigrants | Lebanon | 99.3 /100 | #79 | Exceptional 42.4% |
| Immigrants | Croatia | 99.2 /100 | #80 | Exceptional 42.3% |
Demographics Similar to Slavs by Bachelor's Degree
In terms of bachelor's degree, the demographic groups most similar to Slavs are Sudanese (38.9%, a difference of 0.060%), Immigrants from Africa (38.9%, a difference of 0.080%), Canadian (38.8%, a difference of 0.12%), South American (38.9%, a difference of 0.18%), and Immigrants from Poland (39.0%, a difference of 0.20%).
| Demographics | Rating | Rank | Bachelor's Degree |
| Swedes | 79.2 /100 | #146 | Good 39.1% |
| Immigrants | Sierra Leone | 79.0 /100 | #147 | Good 39.0% |
| Iraqis | 78.1 /100 | #148 | Good 39.0% |
| Immigrants | Poland | 77.5 /100 | #149 | Good 39.0% |
| South Americans | 77.3 /100 | #150 | Good 38.9% |
| Immigrants | Africa | 76.5 /100 | #151 | Good 38.9% |
| Sudanese | 76.4 /100 | #152 | Good 38.9% |
| Slavs | 75.9 /100 | #153 | Good 38.9% |
| Canadians | 75.0 /100 | #154 | Good 38.8% |
| Immigrants | Kenya | 73.8 /100 | #155 | Good 38.8% |
| Kenyans | 72.5 /100 | #156 | Good 38.7% |
| Immigrants | South America | 70.1 /100 | #157 | Good 38.6% |
| Immigrants | Germany | 69.6 /100 | #158 | Good 38.6% |
| Chinese | 66.6 /100 | #159 | Good 38.5% |
| Vietnamese | 66.6 /100 | #160 | Good 38.5% |