Immigrants from Zaire vs Lithuanian Kindergarten
COMPARE
Immigrants from Zaire
Lithuanian
Kindergarten
Kindergarten Comparison
Immigrants from Zaire
Lithuanians
97.7%
KINDERGARTEN
4.5/ 100
METRIC RATING
221st/ 347
METRIC RANK
98.6%
KINDERGARTEN
100.0/ 100
METRIC RATING
21st/ 347
METRIC RANK
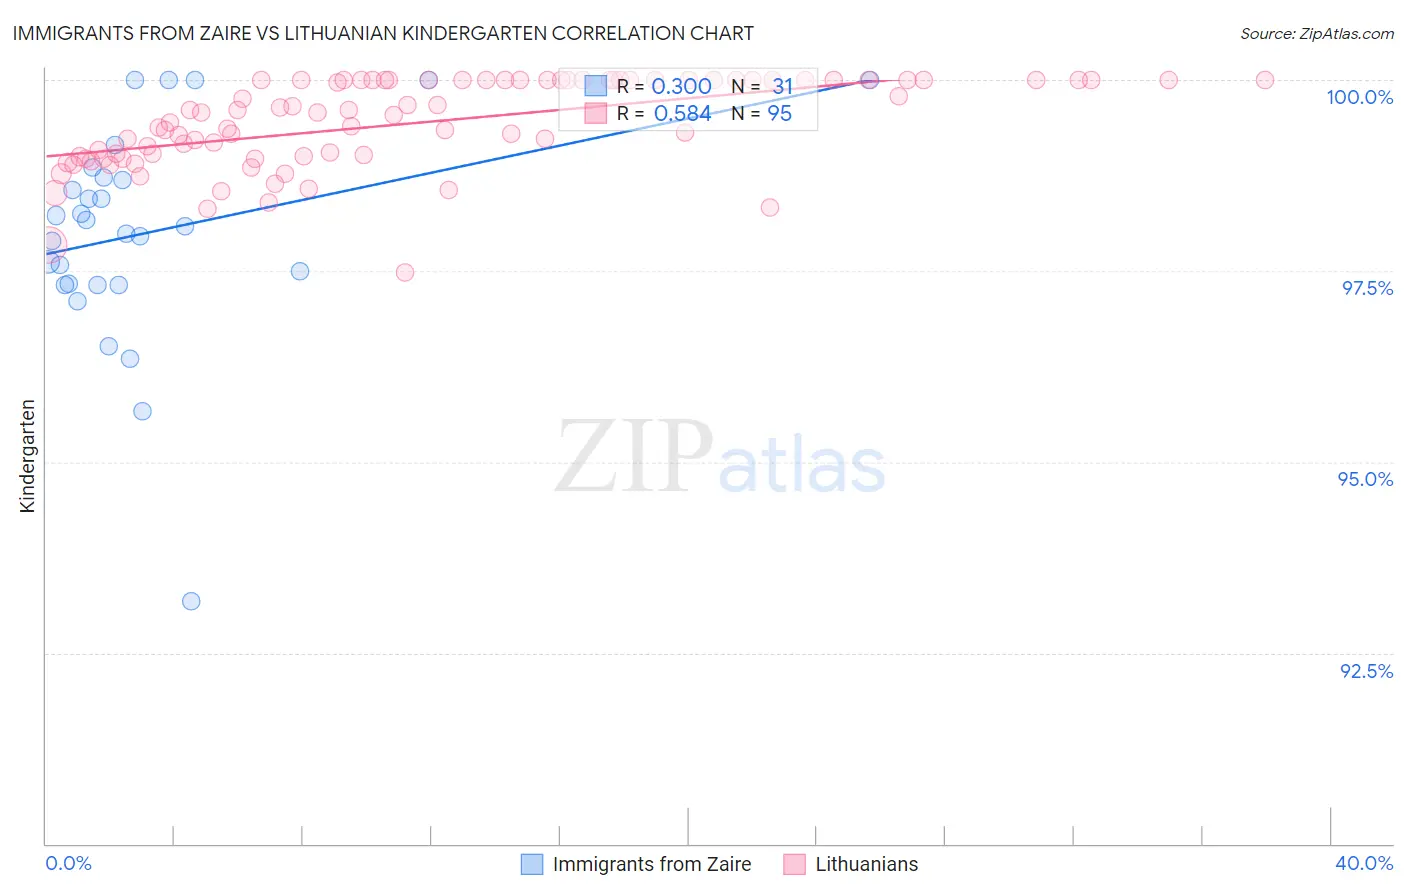
Immigrants from Zaire vs Lithuanian Kindergarten Correlation Chart
The statistical analysis conducted on geographies consisting of 107,250,996 people shows a weak positive correlation between the proportion of Immigrants from Zaire and percentage of population with at least kindergarten education in the United States with a correlation coefficient (R) of 0.300 and weighted average of 97.7%. Similarly, the statistical analysis conducted on geographies consisting of 421,946,231 people shows a substantial positive correlation between the proportion of Lithuanians and percentage of population with at least kindergarten education in the United States with a correlation coefficient (R) of 0.584 and weighted average of 98.6%, a difference of 0.90%.
Kindergarten Correlation Summary
| Measurement | Immigrants from Zaire | Lithuanian |
| Minimum | 93.2% | 97.5% |
| Maximum | 100.0% | 100.0% |
| Range | 6.8% | 2.5% |
| Mean | 98.0% | 99.4% |
| Median | 98.1% | 99.6% |
| Interquartile 25% (IQ1) | 97.3% | 99.0% |
| Interquartile 75% (IQ3) | 98.7% | 100.0% |
| Interquartile Range (IQR) | 1.4% | 1.0% |
| Standard Deviation (Sample) | 1.4% | 0.58% |
| Standard Deviation (Population) | 1.4% | 0.58% |
Similar Demographics by Kindergarten
Demographics Similar to Immigrants from Zaire by Kindergarten
In terms of kindergarten, the demographic groups most similar to Immigrants from Zaire are Tongan (97.7%, a difference of 0.0%), Immigrants from Sudan (97.7%, a difference of 0.0%), Immigrants from Syria (97.7%, a difference of 0.0%), Immigrants from Panama (97.7%, a difference of 0.010%), and Iraqi (97.7%, a difference of 0.010%).
| Demographics | Rating | Rank | Kindergarten |
| Uruguayans | 7.5 /100 | #214 | Tragic 97.8% |
| Immigrants | Bahamas | 7.4 /100 | #215 | Tragic 97.8% |
| Samoans | 6.9 /100 | #216 | Tragic 97.8% |
| Bahamians | 6.6 /100 | #217 | Tragic 97.8% |
| Immigrants | Morocco | 5.4 /100 | #218 | Tragic 97.7% |
| Immigrants | Panama | 5.0 /100 | #219 | Tragic 97.7% |
| Tongans | 4.8 /100 | #220 | Tragic 97.7% |
| Immigrants | Zaire | 4.5 /100 | #221 | Tragic 97.7% |
| Immigrants | Sudan | 4.5 /100 | #222 | Tragic 97.7% |
| Immigrants | Syria | 4.3 /100 | #223 | Tragic 97.7% |
| Iraqis | 3.9 /100 | #224 | Tragic 97.7% |
| Immigrants | Nepal | 3.8 /100 | #225 | Tragic 97.7% |
| Sudanese | 3.7 /100 | #226 | Tragic 97.7% |
| Immigrants | Costa Rica | 3.6 /100 | #227 | Tragic 97.7% |
| Sub-Saharan Africans | 3.5 /100 | #228 | Tragic 97.7% |
Demographics Similar to Lithuanians by Kindergarten
In terms of kindergarten, the demographic groups most similar to Lithuanians are Pennsylvania German (98.6%, a difference of 0.0%), Finnish (98.6%, a difference of 0.0%), Arapaho (98.6%, a difference of 0.0%), Danish (98.6%, a difference of 0.0%), and Sioux (98.6%, a difference of 0.0%).
| Demographics | Rating | Rank | Kindergarten |
| English | 100.0 /100 | #14 | Exceptional 98.7% |
| Swedes | 100.0 /100 | #15 | Exceptional 98.7% |
| Aleuts | 100.0 /100 | #16 | Exceptional 98.6% |
| Scottish | 100.0 /100 | #17 | Exceptional 98.6% |
| Dutch | 100.0 /100 | #18 | Exceptional 98.6% |
| Irish | 100.0 /100 | #19 | Exceptional 98.6% |
| Pennsylvania Germans | 100.0 /100 | #20 | Exceptional 98.6% |
| Lithuanians | 100.0 /100 | #21 | Exceptional 98.6% |
| Finns | 100.0 /100 | #22 | Exceptional 98.6% |
| Arapaho | 100.0 /100 | #23 | Exceptional 98.6% |
| Danes | 100.0 /100 | #24 | Exceptional 98.6% |
| Sioux | 100.0 /100 | #25 | Exceptional 98.6% |
| Poles | 100.0 /100 | #26 | Exceptional 98.6% |
| Scotch-Irish | 100.0 /100 | #27 | Exceptional 98.6% |
| Croatians | 100.0 /100 | #28 | Exceptional 98.6% |