Iraqi vs Immigrants from Western Asia 4th Grade
COMPARE
Iraqi
Immigrants from Western Asia
4th Grade
4th Grade Comparison
Iraqis
Immigrants from Western Asia
97.3%
4TH GRADE
6.3/ 100
METRIC RATING
218th/ 347
METRIC RANK
97.2%
4TH GRADE
3.4/ 100
METRIC RATING
232nd/ 347
METRIC RANK
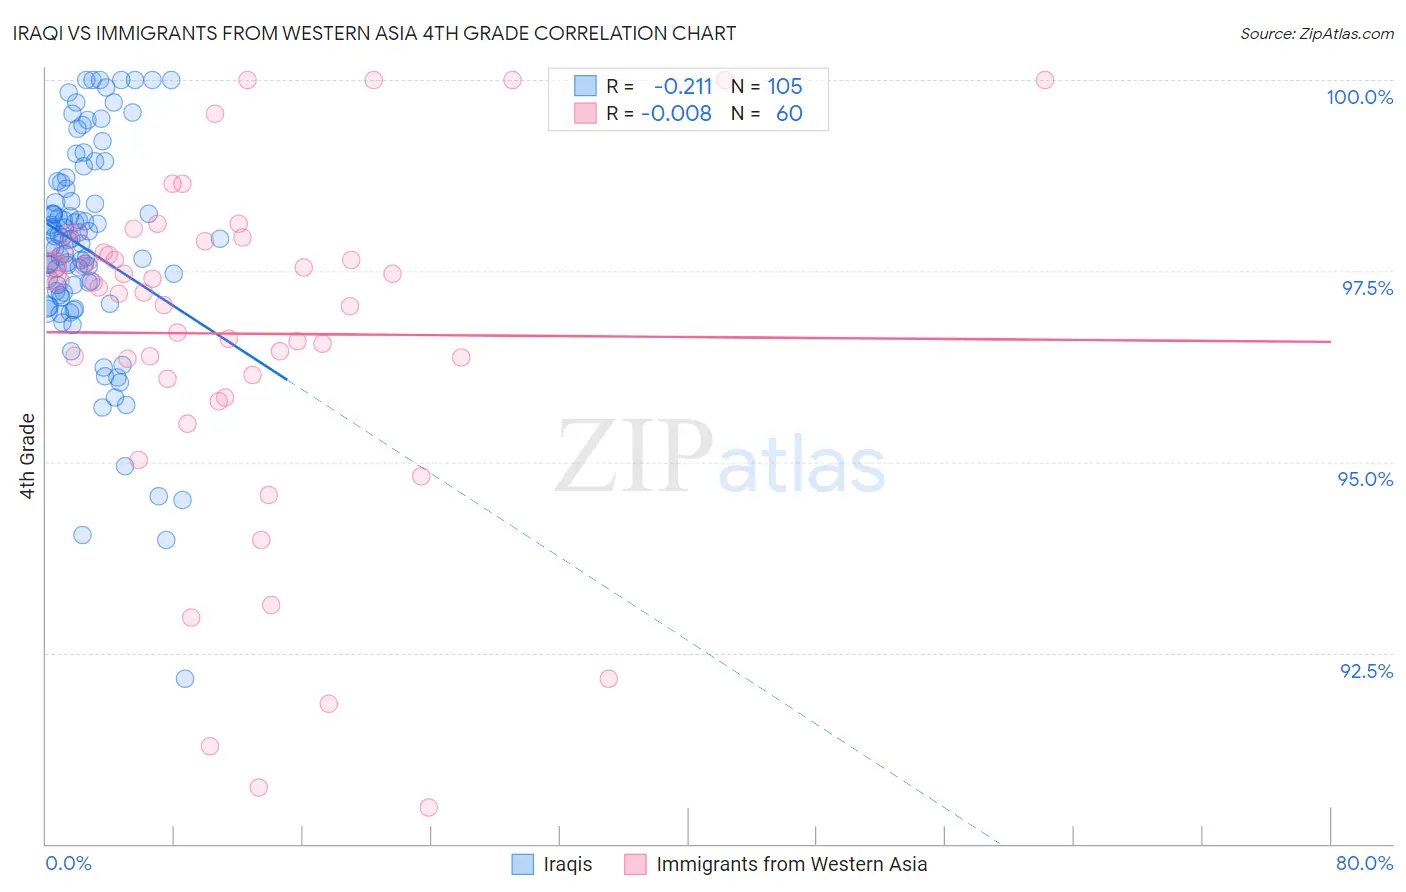
Iraqi vs Immigrants from Western Asia 4th Grade Correlation Chart
The statistical analysis conducted on geographies consisting of 170,614,457 people shows a weak negative correlation between the proportion of Iraqis and percentage of population with at least 4th grade education in the United States with a correlation coefficient (R) of -0.211 and weighted average of 97.3%. Similarly, the statistical analysis conducted on geographies consisting of 404,424,892 people shows no correlation between the proportion of Immigrants from Western Asia and percentage of population with at least 4th grade education in the United States with a correlation coefficient (R) of -0.008 and weighted average of 97.2%, a difference of 0.060%.
4th Grade Correlation Summary
| Measurement | Iraqi | Immigrants from Western Asia |
| Minimum | 92.2% | 90.5% |
| Maximum | 100.0% | 100.0% |
| Range | 7.8% | 9.5% |
| Mean | 97.8% | 96.7% |
| Median | 97.9% | 97.3% |
| Interquartile 25% (IQ1) | 97.2% | 96.1% |
| Interquartile 75% (IQ3) | 98.6% | 97.8% |
| Interquartile Range (IQR) | 1.5% | 1.7% |
| Standard Deviation (Sample) | 1.4% | 2.2% |
| Standard Deviation (Population) | 1.4% | 2.2% |
Demographics Similar to Iraqis and Immigrants from Western Asia by 4th Grade
In terms of 4th grade, the demographic groups most similar to Iraqis are Sierra Leonean (97.3%, a difference of 0.0%), Immigrants from Morocco (97.3%, a difference of 0.010%), Samoan (97.3%, a difference of 0.010%), Tongan (97.3%, a difference of 0.010%), and South American Indian (97.3%, a difference of 0.010%). Similarly, the demographic groups most similar to Immigrants from Western Asia are Uruguayan (97.2%, a difference of 0.0%), Immigrants from Malaysia (97.2%, a difference of 0.0%), Bahamian (97.2%, a difference of 0.010%), Immigrants from Pakistan (97.2%, a difference of 0.010%), and Subsaharan African (97.2%, a difference of 0.010%).
| Demographics | Rating | Rank | 4th Grade |
| Immigrants | Morocco | 7.1 /100 | #215 | Tragic 97.3% |
| Samoans | 6.8 /100 | #216 | Tragic 97.3% |
| Sierra Leoneans | 6.5 /100 | #217 | Tragic 97.3% |
| Iraqis | 6.3 /100 | #218 | Tragic 97.3% |
| Tongans | 5.8 /100 | #219 | Tragic 97.3% |
| South American Indians | 5.5 /100 | #220 | Tragic 97.3% |
| Immigrants | Panama | 5.4 /100 | #221 | Tragic 97.3% |
| Immigrants | Lebanon | 5.1 /100 | #222 | Tragic 97.3% |
| Immigrants | Sudan | 5.0 /100 | #223 | Tragic 97.2% |
| Immigrants | Syria | 5.0 /100 | #224 | Tragic 97.2% |
| Immigrants | Iraq | 4.6 /100 | #225 | Tragic 97.2% |
| Bahamians | 3.8 /100 | #226 | Tragic 97.2% |
| Immigrants | Pakistan | 3.7 /100 | #227 | Tragic 97.2% |
| Sub-Saharan Africans | 3.6 /100 | #228 | Tragic 97.2% |
| Liberians | 3.6 /100 | #229 | Tragic 97.2% |
| Uruguayans | 3.5 /100 | #230 | Tragic 97.2% |
| Immigrants | Malaysia | 3.4 /100 | #231 | Tragic 97.2% |
| Immigrants | Western Asia | 3.4 /100 | #232 | Tragic 97.2% |
| Senegalese | 3.1 /100 | #233 | Tragic 97.2% |
| Assyrians/Chaldeans/Syriacs | 3.0 /100 | #234 | Tragic 97.2% |
| Yuman | 2.9 /100 | #235 | Tragic 97.2% |