Scottish vs Iranian 4th Grade
COMPARE
Scottish
Iranian
4th Grade
4th Grade Comparison
Scottish
Iranians
98.4%
4TH GRADE
100.0/ 100
METRIC RATING
16th/ 347
METRIC RANK
98.0%
4TH GRADE
99.4/ 100
METRIC RATING
72nd/ 347
METRIC RANK
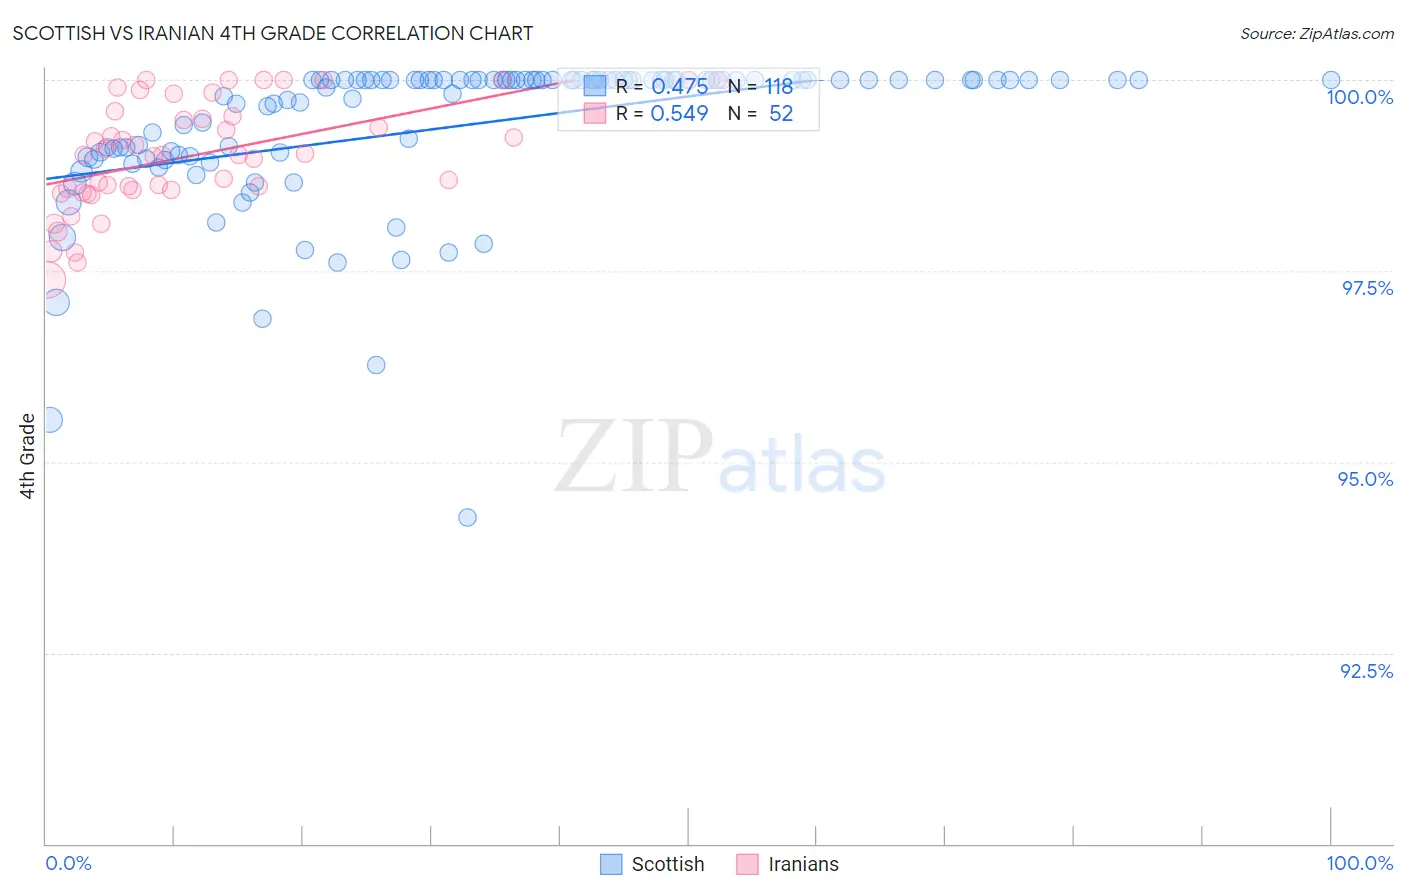
Scottish vs Iranian 4th Grade Correlation Chart
The statistical analysis conducted on geographies consisting of 567,141,733 people shows a moderate positive correlation between the proportion of Scottish and percentage of population with at least 4th grade education in the United States with a correlation coefficient (R) of 0.475 and weighted average of 98.4%. Similarly, the statistical analysis conducted on geographies consisting of 310,635,884 people shows a substantial positive correlation between the proportion of Iranians and percentage of population with at least 4th grade education in the United States with a correlation coefficient (R) of 0.549 and weighted average of 98.0%, a difference of 0.39%.
4th Grade Correlation Summary
| Measurement | Scottish | Iranian |
| Minimum | 94.3% | 97.4% |
| Maximum | 100.0% | 100.0% |
| Range | 5.7% | 2.6% |
| Mean | 99.4% | 99.0% |
| Median | 100.0% | 99.0% |
| Interquartile 25% (IQ1) | 99.0% | 98.6% |
| Interquartile 75% (IQ3) | 100.0% | 99.6% |
| Interquartile Range (IQR) | 0.98% | 1.00% |
| Standard Deviation (Sample) | 0.99% | 0.71% |
| Standard Deviation (Population) | 0.99% | 0.70% |
Similar Demographics by 4th Grade
Demographics Similar to Scottish by 4th Grade
In terms of 4th grade, the demographic groups most similar to Scottish are Dutch (98.4%, a difference of 0.0%), Pennsylvania German (98.4%, a difference of 0.0%), Polish (98.4%, a difference of 0.010%), Irish (98.4%, a difference of 0.010%), and Alaska Native (98.4%, a difference of 0.020%).
| Demographics | Rating | Rank | 4th Grade |
| Slovenes | 100.0 /100 | #9 | Exceptional 98.4% |
| Alaskan Athabascans | 100.0 /100 | #10 | Exceptional 98.4% |
| English | 100.0 /100 | #11 | Exceptional 98.4% |
| Tlingit-Haida | 100.0 /100 | #12 | Exceptional 98.4% |
| Swedes | 100.0 /100 | #13 | Exceptional 98.4% |
| Carpatho Rusyns | 100.0 /100 | #14 | Exceptional 98.4% |
| Dutch | 100.0 /100 | #15 | Exceptional 98.4% |
| Scottish | 100.0 /100 | #16 | Exceptional 98.4% |
| Pennsylvania Germans | 100.0 /100 | #17 | Exceptional 98.4% |
| Poles | 100.0 /100 | #18 | Exceptional 98.4% |
| Irish | 100.0 /100 | #19 | Exceptional 98.4% |
| Alaska Natives | 100.0 /100 | #20 | Exceptional 98.4% |
| Lithuanians | 100.0 /100 | #21 | Exceptional 98.3% |
| Finns | 100.0 /100 | #22 | Exceptional 98.3% |
| Sioux | 100.0 /100 | #23 | Exceptional 98.3% |
Demographics Similar to Iranians by 4th Grade
In terms of 4th grade, the demographic groups most similar to Iranians are Macedonian (98.0%, a difference of 0.0%), Chickasaw (98.0%, a difference of 0.010%), Immigrants from Netherlands (98.0%, a difference of 0.020%), Cherokee (98.0%, a difference of 0.020%), and Immigrants from Lithuania (98.0%, a difference of 0.020%).
| Demographics | Rating | Rank | 4th Grade |
| Immigrants | Northern Europe | 99.6 /100 | #65 | Exceptional 98.0% |
| Canadians | 99.6 /100 | #66 | Exceptional 98.0% |
| New Zealanders | 99.6 /100 | #67 | Exceptional 98.0% |
| Kiowa | 99.6 /100 | #68 | Exceptional 98.0% |
| Pueblo | 99.6 /100 | #69 | Exceptional 98.0% |
| Immigrants | Austria | 99.6 /100 | #70 | Exceptional 98.0% |
| Lumbee | 99.6 /100 | #71 | Exceptional 98.0% |
| Iranians | 99.4 /100 | #72 | Exceptional 98.0% |
| Macedonians | 99.4 /100 | #73 | Exceptional 98.0% |
| Chickasaw | 99.4 /100 | #74 | Exceptional 98.0% |
| Immigrants | Netherlands | 99.3 /100 | #75 | Exceptional 98.0% |
| Cherokee | 99.3 /100 | #76 | Exceptional 98.0% |
| Immigrants | Lithuania | 99.3 /100 | #77 | Exceptional 98.0% |
| Immigrants | England | 99.3 /100 | #78 | Exceptional 98.0% |
| Ukrainians | 99.2 /100 | #79 | Exceptional 98.0% |