Scottish vs Immigrants from Egypt 4th Grade
COMPARE
Scottish
Immigrants from Egypt
4th Grade
4th Grade Comparison
Scottish
Immigrants from Egypt
98.4%
4TH GRADE
100.0/ 100
METRIC RATING
16th/ 347
METRIC RANK
97.4%
4TH GRADE
30.1/ 100
METRIC RATING
193rd/ 347
METRIC RANK
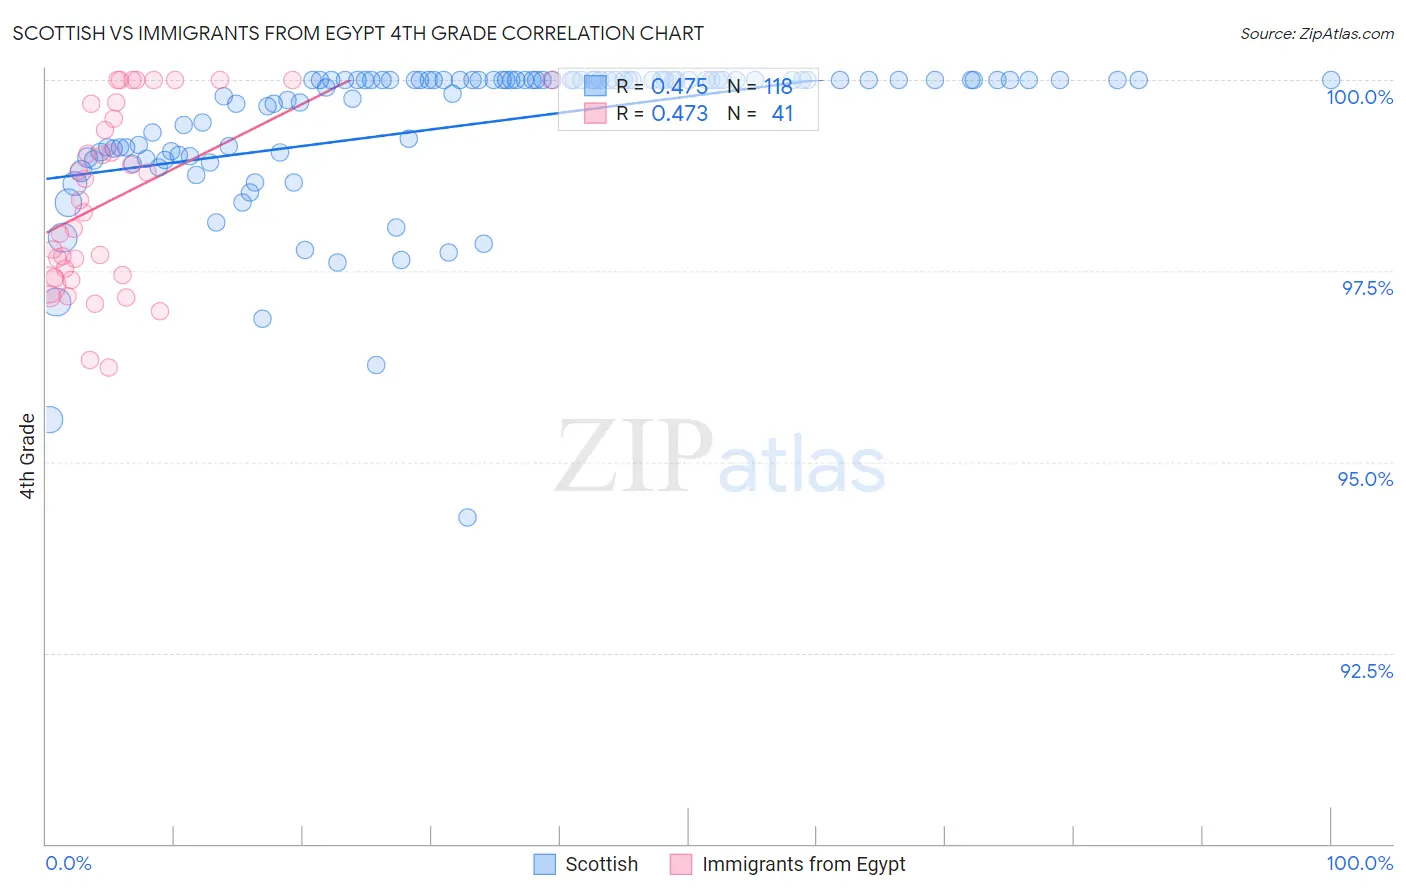
Scottish vs Immigrants from Egypt 4th Grade Correlation Chart
The statistical analysis conducted on geographies consisting of 567,141,733 people shows a moderate positive correlation between the proportion of Scottish and percentage of population with at least 4th grade education in the United States with a correlation coefficient (R) of 0.475 and weighted average of 98.4%. Similarly, the statistical analysis conducted on geographies consisting of 245,485,794 people shows a moderate positive correlation between the proportion of Immigrants from Egypt and percentage of population with at least 4th grade education in the United States with a correlation coefficient (R) of 0.473 and weighted average of 97.4%, a difference of 0.96%.
4th Grade Correlation Summary
| Measurement | Scottish | Immigrants from Egypt |
| Minimum | 94.3% | 96.2% |
| Maximum | 100.0% | 100.0% |
| Range | 5.7% | 3.8% |
| Mean | 99.4% | 98.5% |
| Median | 100.0% | 98.4% |
| Interquartile 25% (IQ1) | 99.0% | 97.4% |
| Interquartile 75% (IQ3) | 100.0% | 99.7% |
| Interquartile Range (IQR) | 0.98% | 2.3% |
| Standard Deviation (Sample) | 0.99% | 1.2% |
| Standard Deviation (Population) | 0.99% | 1.2% |
Similar Demographics by 4th Grade
Demographics Similar to Scottish by 4th Grade
In terms of 4th grade, the demographic groups most similar to Scottish are Dutch (98.4%, a difference of 0.0%), Pennsylvania German (98.4%, a difference of 0.0%), Polish (98.4%, a difference of 0.010%), Irish (98.4%, a difference of 0.010%), and Alaska Native (98.4%, a difference of 0.020%).
| Demographics | Rating | Rank | 4th Grade |
| Slovenes | 100.0 /100 | #9 | Exceptional 98.4% |
| Alaskan Athabascans | 100.0 /100 | #10 | Exceptional 98.4% |
| English | 100.0 /100 | #11 | Exceptional 98.4% |
| Tlingit-Haida | 100.0 /100 | #12 | Exceptional 98.4% |
| Swedes | 100.0 /100 | #13 | Exceptional 98.4% |
| Carpatho Rusyns | 100.0 /100 | #14 | Exceptional 98.4% |
| Dutch | 100.0 /100 | #15 | Exceptional 98.4% |
| Scottish | 100.0 /100 | #16 | Exceptional 98.4% |
| Pennsylvania Germans | 100.0 /100 | #17 | Exceptional 98.4% |
| Poles | 100.0 /100 | #18 | Exceptional 98.4% |
| Irish | 100.0 /100 | #19 | Exceptional 98.4% |
| Alaska Natives | 100.0 /100 | #20 | Exceptional 98.4% |
| Lithuanians | 100.0 /100 | #21 | Exceptional 98.3% |
| Finns | 100.0 /100 | #22 | Exceptional 98.3% |
| Sioux | 100.0 /100 | #23 | Exceptional 98.3% |
Demographics Similar to Immigrants from Egypt by 4th Grade
In terms of 4th grade, the demographic groups most similar to Immigrants from Egypt are Black/African American (97.4%, a difference of 0.0%), Navajo (97.4%, a difference of 0.0%), Immigrants from Ukraine (97.4%, a difference of 0.0%), Portuguese (97.4%, a difference of 0.0%), and Panamanian (97.4%, a difference of 0.010%).
| Demographics | Rating | Rank | 4th Grade |
| Dutch West Indians | 35.8 /100 | #186 | Fair 97.5% |
| Mongolians | 34.7 /100 | #187 | Fair 97.5% |
| Immigrants | Argentina | 34.6 /100 | #188 | Fair 97.5% |
| Panamanians | 31.9 /100 | #189 | Fair 97.4% |
| Blacks/African Americans | 31.1 /100 | #190 | Fair 97.4% |
| Navajo | 30.7 /100 | #191 | Fair 97.4% |
| Immigrants | Ukraine | 30.1 /100 | #192 | Fair 97.4% |
| Immigrants | Egypt | 30.1 /100 | #193 | Fair 97.4% |
| Portuguese | 29.2 /100 | #194 | Fair 97.4% |
| Paraguayans | 28.9 /100 | #195 | Fair 97.4% |
| Immigrants | Albania | 27.7 /100 | #196 | Fair 97.4% |
| Hawaiians | 25.6 /100 | #197 | Fair 97.4% |
| Guamanians/Chamorros | 23.0 /100 | #198 | Fair 97.4% |
| Natives/Alaskans | 20.6 /100 | #199 | Fair 97.4% |
| Immigrants | Uganda | 19.8 /100 | #200 | Poor 97.4% |