Sierra Leonean vs Ethiopian 11th Grade
COMPARE
Sierra Leonean
Ethiopian
11th Grade
11th Grade Comparison
Sierra Leoneans
Ethiopians
92.6%
11TH GRADE
58.7/ 100
METRIC RATING
168th/ 347
METRIC RANK
92.2%
11TH GRADE
18.8/ 100
METRIC RATING
210th/ 347
METRIC RANK
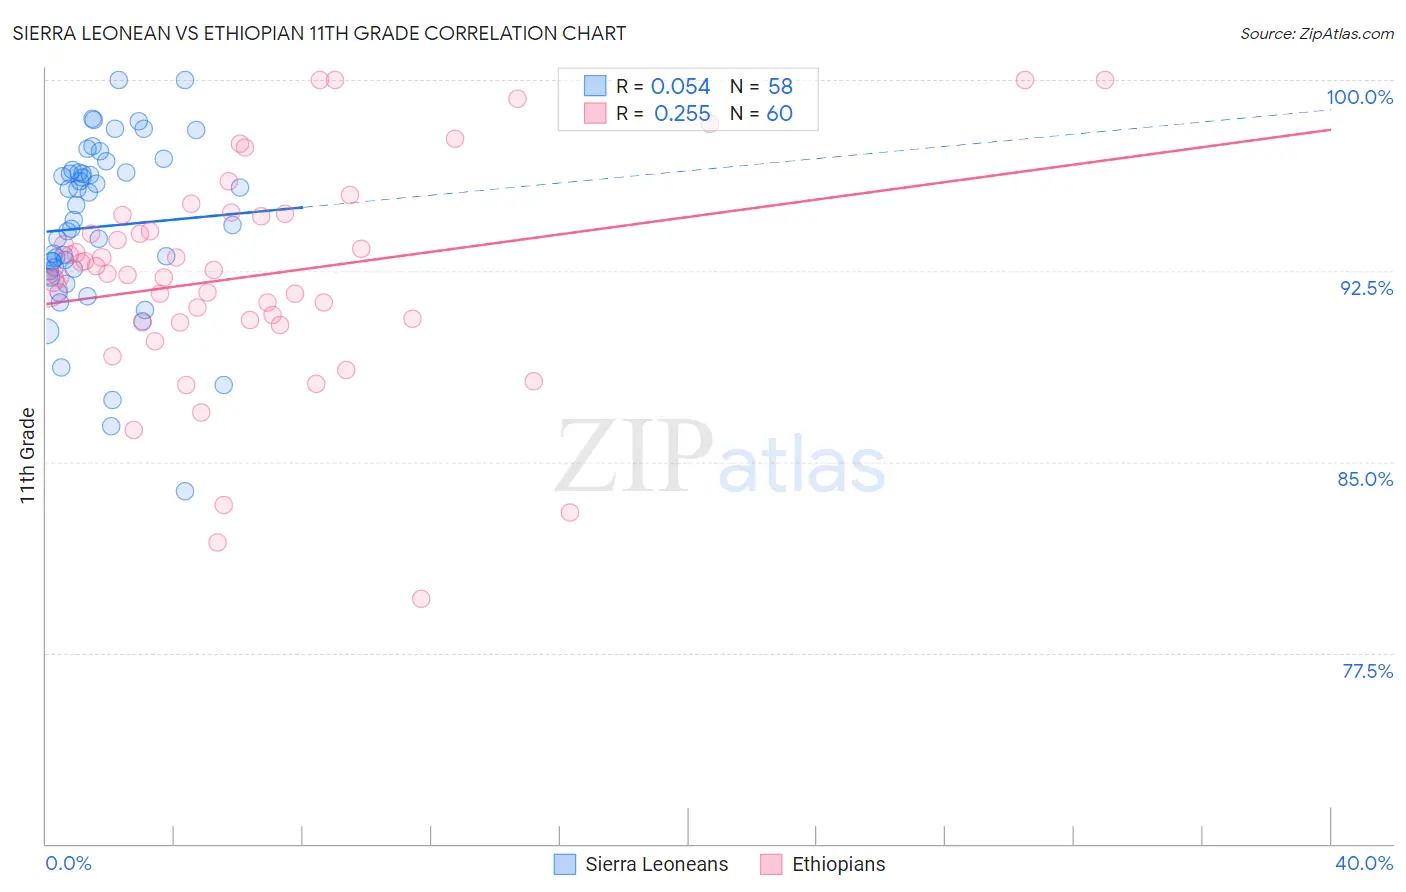
Sierra Leonean vs Ethiopian 11th Grade Correlation Chart
The statistical analysis conducted on geographies consisting of 83,355,497 people shows a slight positive correlation between the proportion of Sierra Leoneans and percentage of population with at least 11th grade education in the United States with a correlation coefficient (R) of 0.054 and weighted average of 92.6%. Similarly, the statistical analysis conducted on geographies consisting of 223,161,778 people shows a weak positive correlation between the proportion of Ethiopians and percentage of population with at least 11th grade education in the United States with a correlation coefficient (R) of 0.255 and weighted average of 92.2%, a difference of 0.45%.
11th Grade Correlation Summary
| Measurement | Sierra Leonean | Ethiopian |
| Minimum | 83.9% | 79.6% |
| Maximum | 100.0% | 100.0% |
| Range | 16.1% | 20.4% |
| Mean | 94.2% | 92.3% |
| Median | 94.4% | 92.5% |
| Interquartile 25% (IQ1) | 92.5% | 90.5% |
| Interquartile 75% (IQ3) | 96.4% | 94.7% |
| Interquartile Range (IQR) | 3.9% | 4.1% |
| Standard Deviation (Sample) | 3.3% | 4.3% |
| Standard Deviation (Population) | 3.3% | 4.3% |
Similar Demographics by 11th Grade
Demographics Similar to Sierra Leoneans by 11th Grade
In terms of 11th grade, the demographic groups most similar to Sierra Leoneans are Immigrants from Albania (92.6%, a difference of 0.010%), Immigrants from Northern Africa (92.6%, a difference of 0.010%), Alsatian (92.6%, a difference of 0.020%), Bermudan (92.6%, a difference of 0.040%), and Laotian (92.6%, a difference of 0.040%).
| Demographics | Rating | Rank | 11th Grade |
| Immigrants | Argentina | 69.8 /100 | #161 | Good 92.7% |
| Paraguayans | 68.7 /100 | #162 | Good 92.7% |
| Immigrants | Nonimmigrants | 66.6 /100 | #163 | Good 92.7% |
| Spanish | 66.2 /100 | #164 | Good 92.7% |
| Immigrants | Iraq | 63.7 /100 | #165 | Good 92.6% |
| Bermudans | 62.3 /100 | #166 | Good 92.6% |
| Alsatians | 60.2 /100 | #167 | Good 92.6% |
| Sierra Leoneans | 58.7 /100 | #168 | Average 92.6% |
| Immigrants | Albania | 57.8 /100 | #169 | Average 92.6% |
| Immigrants | Northern Africa | 57.3 /100 | #170 | Average 92.6% |
| Laotians | 54.4 /100 | #171 | Average 92.6% |
| Immigrants | Pakistan | 52.3 /100 | #172 | Average 92.5% |
| Indians (Asian) | 51.5 /100 | #173 | Average 92.5% |
| Asians | 50.0 /100 | #174 | Average 92.5% |
| Shoshone | 48.9 /100 | #175 | Average 92.5% |
Demographics Similar to Ethiopians by 11th Grade
In terms of 11th grade, the demographic groups most similar to Ethiopians are Tongan (92.2%, a difference of 0.010%), Immigrants from Micronesia (92.2%, a difference of 0.020%), Colville (92.2%, a difference of 0.040%), Immigrants from Oceania (92.2%, a difference of 0.050%), and Immigrants from Sudan (92.3%, a difference of 0.070%).
| Demographics | Rating | Rank | 11th Grade |
| Immigrants | Sudan | 23.5 /100 | #203 | Fair 92.3% |
| Immigrants | Hong Kong | 23.3 /100 | #204 | Fair 92.2% |
| Kiowa | 23.2 /100 | #205 | Fair 92.2% |
| Bolivians | 23.2 /100 | #206 | Fair 92.2% |
| Immigrants | Oceania | 22.4 /100 | #207 | Fair 92.2% |
| Colville | 21.8 /100 | #208 | Fair 92.2% |
| Tongans | 19.8 /100 | #209 | Poor 92.2% |
| Ethiopians | 18.8 /100 | #210 | Poor 92.2% |
| Immigrants | Micronesia | 17.7 /100 | #211 | Poor 92.2% |
| Koreans | 14.4 /100 | #212 | Poor 92.1% |
| Immigrants | Ethiopia | 13.9 /100 | #213 | Poor 92.1% |
| Afghans | 12.8 /100 | #214 | Poor 92.1% |
| Immigrants | Southern Europe | 12.5 /100 | #215 | Poor 92.1% |
| Somalis | 11.6 /100 | #216 | Poor 92.1% |
| Immigrants | Sierra Leone | 11.1 /100 | #217 | Poor 92.0% |