Immigrants from Congo vs Ethiopian 11th Grade
COMPARE
Immigrants from Congo
Ethiopian
11th Grade
11th Grade Comparison
Immigrants from Congo
Ethiopians
90.9%
11TH GRADE
0.1/ 100
METRIC RATING
277th/ 347
METRIC RANK
92.2%
11TH GRADE
18.8/ 100
METRIC RATING
210th/ 347
METRIC RANK
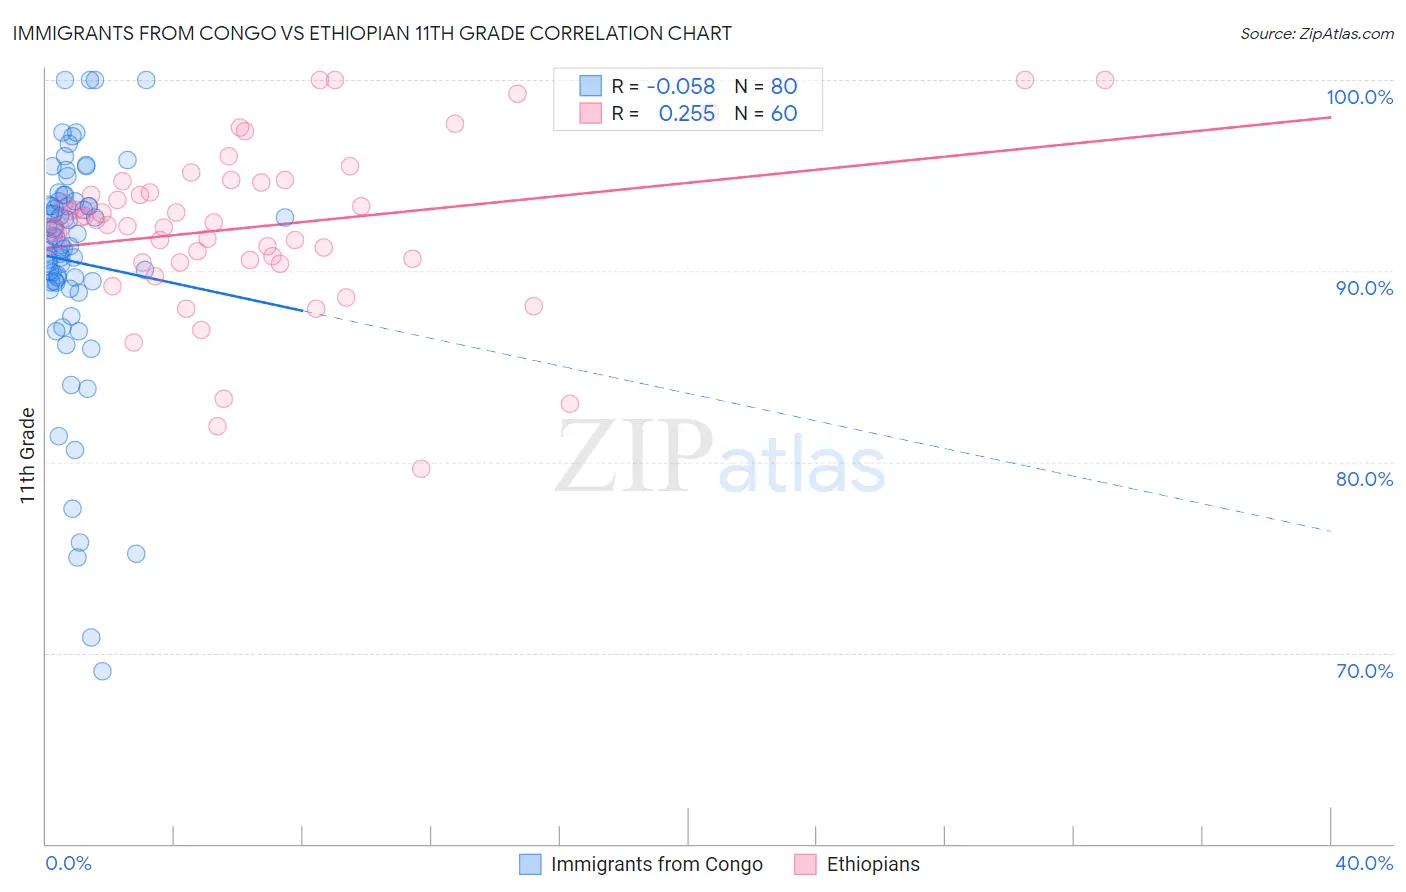
Immigrants from Congo vs Ethiopian 11th Grade Correlation Chart
The statistical analysis conducted on geographies consisting of 92,134,351 people shows a slight negative correlation between the proportion of Immigrants from Congo and percentage of population with at least 11th grade education in the United States with a correlation coefficient (R) of -0.058 and weighted average of 90.9%. Similarly, the statistical analysis conducted on geographies consisting of 223,161,778 people shows a weak positive correlation between the proportion of Ethiopians and percentage of population with at least 11th grade education in the United States with a correlation coefficient (R) of 0.255 and weighted average of 92.2%, a difference of 1.5%.
11th Grade Correlation Summary
| Measurement | Immigrants from Congo | Ethiopian |
| Minimum | 69.1% | 79.6% |
| Maximum | 100.0% | 100.0% |
| Range | 30.9% | 20.4% |
| Mean | 90.5% | 92.3% |
| Median | 91.6% | 92.5% |
| Interquartile 25% (IQ1) | 89.4% | 90.5% |
| Interquartile 75% (IQ3) | 93.5% | 94.7% |
| Interquartile Range (IQR) | 4.1% | 4.1% |
| Standard Deviation (Sample) | 6.1% | 4.3% |
| Standard Deviation (Population) | 6.1% | 4.3% |
Similar Demographics by 11th Grade
Demographics Similar to Immigrants from Congo by 11th Grade
In terms of 11th grade, the demographic groups most similar to Immigrants from Congo are Bangladeshi (90.9%, a difference of 0.020%), Malaysian (90.8%, a difference of 0.040%), Barbadian (90.8%, a difference of 0.080%), Immigrants from South Eastern Asia (90.9%, a difference of 0.090%), and Immigrants from Trinidad and Tobago (90.9%, a difference of 0.10%).
| Demographics | Rating | Rank | 11th Grade |
| Trinidadians and Tobagonians | 0.2 /100 | #270 | Tragic 91.1% |
| Immigrants | Peru | 0.1 /100 | #271 | Tragic 91.0% |
| West Indians | 0.1 /100 | #272 | Tragic 91.0% |
| Paiute | 0.1 /100 | #273 | Tragic 91.0% |
| Immigrants | Trinidad and Tobago | 0.1 /100 | #274 | Tragic 90.9% |
| Immigrants | South Eastern Asia | 0.1 /100 | #275 | Tragic 90.9% |
| Bangladeshis | 0.1 /100 | #276 | Tragic 90.9% |
| Immigrants | Congo | 0.1 /100 | #277 | Tragic 90.9% |
| Malaysians | 0.1 /100 | #278 | Tragic 90.8% |
| Barbadians | 0.0 /100 | #279 | Tragic 90.8% |
| Sri Lankans | 0.0 /100 | #280 | Tragic 90.7% |
| Dutch West Indians | 0.0 /100 | #281 | Tragic 90.7% |
| Immigrants | St. Vincent and the Grenadines | 0.0 /100 | #282 | Tragic 90.7% |
| Immigrants | Barbados | 0.0 /100 | #283 | Tragic 90.7% |
| Immigrants | Laos | 0.0 /100 | #284 | Tragic 90.5% |
Demographics Similar to Ethiopians by 11th Grade
In terms of 11th grade, the demographic groups most similar to Ethiopians are Tongan (92.2%, a difference of 0.010%), Immigrants from Micronesia (92.2%, a difference of 0.020%), Colville (92.2%, a difference of 0.040%), Immigrants from Oceania (92.2%, a difference of 0.050%), and Immigrants from Sudan (92.3%, a difference of 0.070%).
| Demographics | Rating | Rank | 11th Grade |
| Immigrants | Sudan | 23.5 /100 | #203 | Fair 92.3% |
| Immigrants | Hong Kong | 23.3 /100 | #204 | Fair 92.2% |
| Kiowa | 23.2 /100 | #205 | Fair 92.2% |
| Bolivians | 23.2 /100 | #206 | Fair 92.2% |
| Immigrants | Oceania | 22.4 /100 | #207 | Fair 92.2% |
| Colville | 21.8 /100 | #208 | Fair 92.2% |
| Tongans | 19.8 /100 | #209 | Poor 92.2% |
| Ethiopians | 18.8 /100 | #210 | Poor 92.2% |
| Immigrants | Micronesia | 17.7 /100 | #211 | Poor 92.2% |
| Koreans | 14.4 /100 | #212 | Poor 92.1% |
| Immigrants | Ethiopia | 13.9 /100 | #213 | Poor 92.1% |
| Afghans | 12.8 /100 | #214 | Poor 92.1% |
| Immigrants | Southern Europe | 12.5 /100 | #215 | Poor 92.1% |
| Somalis | 11.6 /100 | #216 | Poor 92.1% |
| Immigrants | Sierra Leone | 11.1 /100 | #217 | Poor 92.0% |