Scottish vs Immigrants from Zaire 11th Grade
COMPARE
Scottish
Immigrants from Zaire
11th Grade
11th Grade Comparison
Scottish
Immigrants from Zaire
94.4%
11TH GRADE
100.0/ 100
METRIC RATING
26th/ 347
METRIC RANK
91.9%
11TH GRADE
5.4/ 100
METRIC RATING
225th/ 347
METRIC RANK
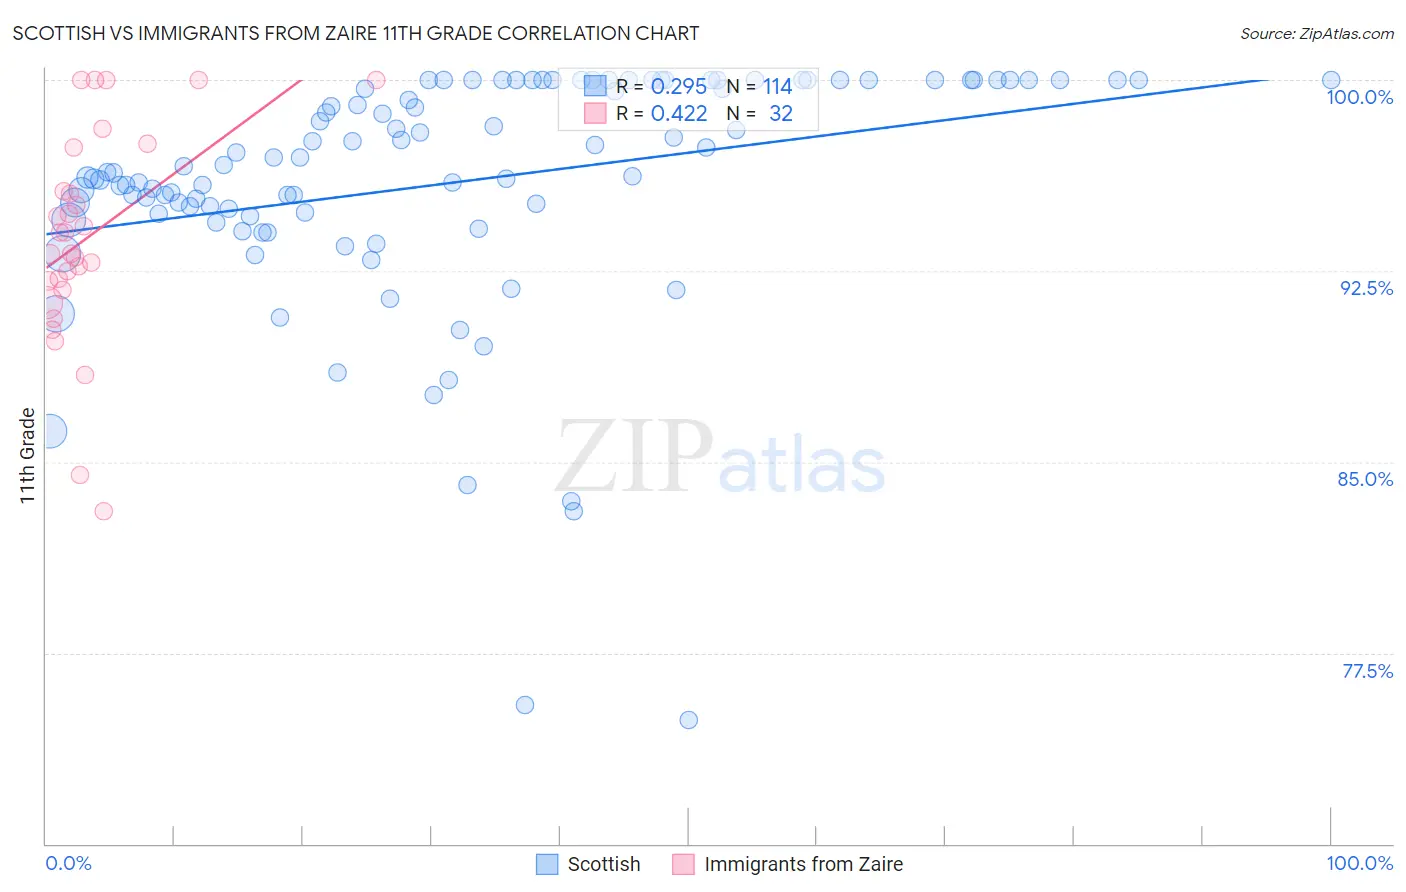
Scottish vs Immigrants from Zaire 11th Grade Correlation Chart
The statistical analysis conducted on geographies consisting of 567,140,505 people shows a weak positive correlation between the proportion of Scottish and percentage of population with at least 11th grade education in the United States with a correlation coefficient (R) of 0.295 and weighted average of 94.4%. Similarly, the statistical analysis conducted on geographies consisting of 107,255,805 people shows a moderate positive correlation between the proportion of Immigrants from Zaire and percentage of population with at least 11th grade education in the United States with a correlation coefficient (R) of 0.422 and weighted average of 91.9%, a difference of 2.7%.
11th Grade Correlation Summary
| Measurement | Scottish | Immigrants from Zaire |
| Minimum | 74.9% | 83.1% |
| Maximum | 100.0% | 100.0% |
| Range | 25.1% | 16.9% |
| Mean | 96.0% | 93.8% |
| Median | 96.5% | 93.6% |
| Interquartile 25% (IQ1) | 94.7% | 91.9% |
| Interquartile 75% (IQ3) | 100.0% | 96.5% |
| Interquartile Range (IQR) | 5.3% | 4.6% |
| Standard Deviation (Sample) | 4.7% | 4.2% |
| Standard Deviation (Population) | 4.7% | 4.1% |
Similar Demographics by 11th Grade
Demographics Similar to Scottish by 11th Grade
In terms of 11th grade, the demographic groups most similar to Scottish are Irish (94.4%, a difference of 0.0%), English (94.4%, a difference of 0.020%), European (94.4%, a difference of 0.020%), Estonian (94.4%, a difference of 0.030%), and Tsimshian (94.4%, a difference of 0.050%).
| Demographics | Rating | Rank | 11th Grade |
| Scandinavians | 100.0 /100 | #19 | Exceptional 94.5% |
| Italians | 100.0 /100 | #20 | Exceptional 94.5% |
| Tlingit-Haida | 100.0 /100 | #21 | Exceptional 94.4% |
| Tsimshian | 100.0 /100 | #22 | Exceptional 94.4% |
| Czechs | 100.0 /100 | #23 | Exceptional 94.4% |
| English | 100.0 /100 | #24 | Exceptional 94.4% |
| Irish | 100.0 /100 | #25 | Exceptional 94.4% |
| Scottish | 100.0 /100 | #26 | Exceptional 94.4% |
| Europeans | 100.0 /100 | #27 | Exceptional 94.4% |
| Estonians | 100.0 /100 | #28 | Exceptional 94.4% |
| Dutch | 100.0 /100 | #29 | Exceptional 94.3% |
| Russians | 100.0 /100 | #30 | Exceptional 94.3% |
| Welsh | 99.9 /100 | #31 | Exceptional 94.2% |
| Belgians | 99.9 /100 | #32 | Exceptional 94.2% |
| British | 99.9 /100 | #33 | Exceptional 94.2% |
Demographics Similar to Immigrants from Zaire by 11th Grade
In terms of 11th grade, the demographic groups most similar to Immigrants from Zaire are Immigrants from Somalia (91.9%, a difference of 0.010%), Costa Rican (91.9%, a difference of 0.040%), Immigrants from Africa (91.9%, a difference of 0.050%), Immigrants from Bahamas (91.9%, a difference of 0.050%), and Immigrants from Cameroon (91.8%, a difference of 0.060%).
| Demographics | Rating | Rank | 11th Grade |
| Blackfeet | 10.1 /100 | #218 | Poor 92.0% |
| Portuguese | 10.0 /100 | #219 | Tragic 92.0% |
| South American Indians | 7.6 /100 | #220 | Tragic 92.0% |
| Immigrants | Liberia | 7.0 /100 | #221 | Tragic 91.9% |
| Immigrants | Africa | 6.5 /100 | #222 | Tragic 91.9% |
| Immigrants | Bahamas | 6.5 /100 | #223 | Tragic 91.9% |
| Costa Ricans | 6.3 /100 | #224 | Tragic 91.9% |
| Immigrants | Zaire | 5.4 /100 | #225 | Tragic 91.9% |
| Immigrants | Somalia | 5.2 /100 | #226 | Tragic 91.9% |
| Immigrants | Cameroon | 4.4 /100 | #227 | Tragic 91.8% |
| Immigrants | Panama | 4.3 /100 | #228 | Tragic 91.8% |
| Nigerians | 4.3 /100 | #229 | Tragic 91.8% |
| Immigrants | Afghanistan | 3.9 /100 | #230 | Tragic 91.8% |
| Choctaw | 3.7 /100 | #231 | Tragic 91.8% |
| Uruguayans | 3.5 /100 | #232 | Tragic 91.8% |