Immigrants from Cabo Verde vs Moroccan 6th Grade
COMPARE
Immigrants from Cabo Verde
Moroccan
6th Grade
6th Grade Comparison
Immigrants from Cabo Verde
Moroccans
94.4%
6TH GRADE
0.0/ 100
METRIC RATING
338th/ 347
METRIC RANK
96.8%
6TH GRADE
9.0/ 100
METRIC RATING
212th/ 347
METRIC RANK
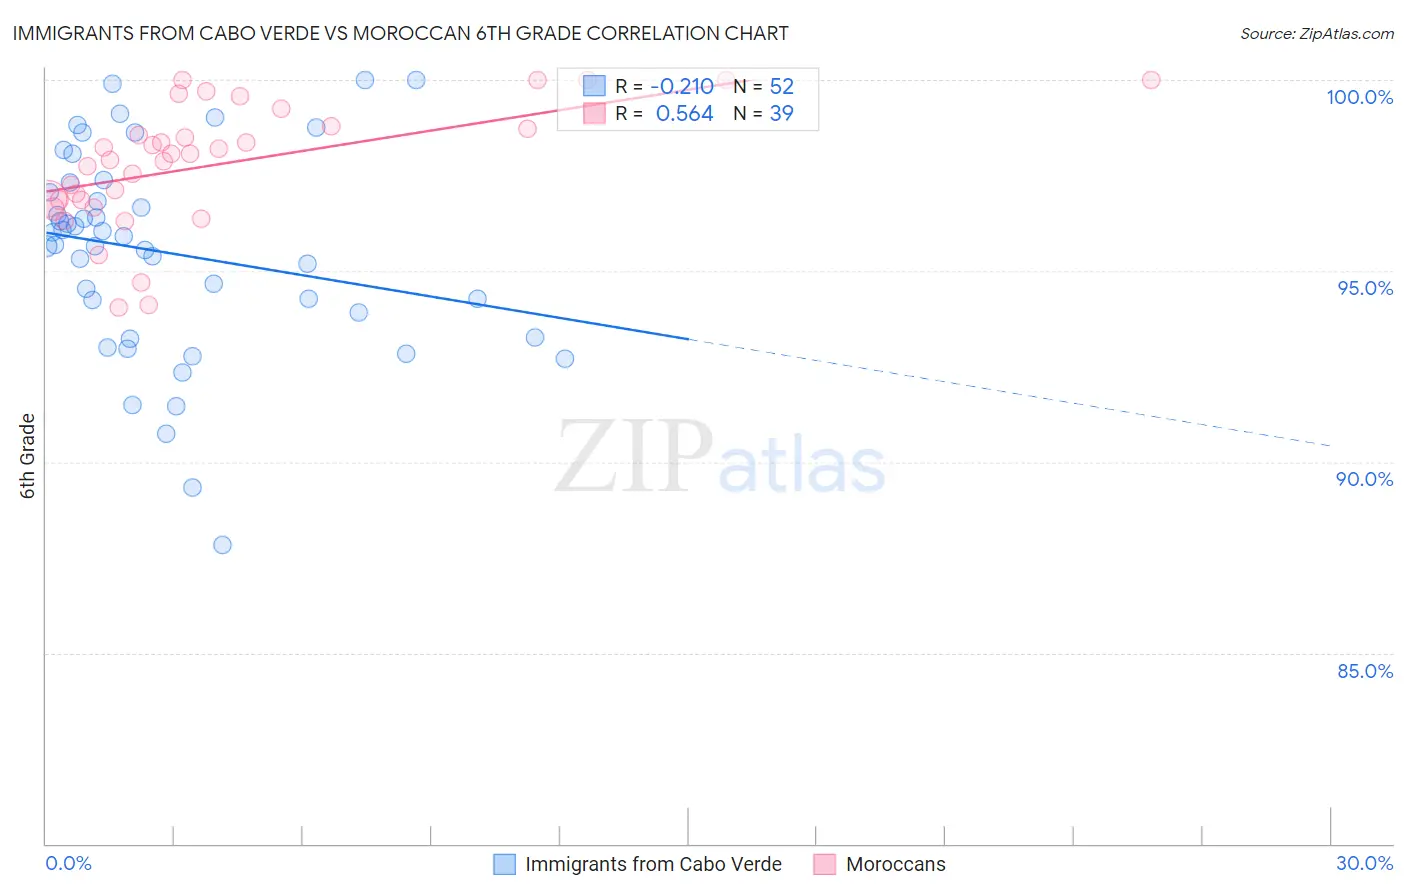
Immigrants from Cabo Verde vs Moroccan 6th Grade Correlation Chart
The statistical analysis conducted on geographies consisting of 38,113,948 people shows a weak negative correlation between the proportion of Immigrants from Cabo Verde and percentage of population with at least 6th grade education in the United States with a correlation coefficient (R) of -0.210 and weighted average of 94.4%. Similarly, the statistical analysis conducted on geographies consisting of 201,817,667 people shows a substantial positive correlation between the proportion of Moroccans and percentage of population with at least 6th grade education in the United States with a correlation coefficient (R) of 0.564 and weighted average of 96.8%, a difference of 2.5%.
6th Grade Correlation Summary
| Measurement | Immigrants from Cabo Verde | Moroccan |
| Minimum | 87.8% | 94.0% |
| Maximum | 100.0% | 100.0% |
| Range | 12.2% | 6.0% |
| Mean | 95.5% | 97.8% |
| Median | 95.8% | 98.1% |
| Interquartile 25% (IQ1) | 93.6% | 96.9% |
| Interquartile 75% (IQ3) | 97.2% | 98.8% |
| Interquartile Range (IQR) | 3.6% | 1.9% |
| Standard Deviation (Sample) | 2.7% | 1.6% |
| Standard Deviation (Population) | 2.7% | 1.6% |
Similar Demographics by 6th Grade
Demographics Similar to Immigrants from Cabo Verde by 6th Grade
In terms of 6th grade, the demographic groups most similar to Immigrants from Cabo Verde are Central American (94.5%, a difference of 0.010%), Yakama (94.3%, a difference of 0.15%), Immigrants from Dominican Republic (94.6%, a difference of 0.18%), Mexican (94.6%, a difference of 0.20%), and Immigrants from the Azores (94.7%, a difference of 0.23%).
| Demographics | Rating | Rank | 6th Grade |
| Immigrants | Armenia | 0.0 /100 | #331 | Tragic 94.9% |
| Immigrants | Honduras | 0.0 /100 | #332 | Tragic 94.8% |
| Immigrants | Latin America | 0.0 /100 | #333 | Tragic 94.7% |
| Immigrants | Azores | 0.0 /100 | #334 | Tragic 94.7% |
| Mexicans | 0.0 /100 | #335 | Tragic 94.6% |
| Immigrants | Dominican Republic | 0.0 /100 | #336 | Tragic 94.6% |
| Central Americans | 0.0 /100 | #337 | Tragic 94.5% |
| Immigrants | Cabo Verde | 0.0 /100 | #338 | Tragic 94.4% |
| Yakama | 0.0 /100 | #339 | Tragic 94.3% |
| Guatemalans | 0.0 /100 | #340 | Tragic 94.2% |
| Immigrants | Yemen | 0.0 /100 | #341 | Tragic 94.1% |
| Immigrants | Central America | 0.0 /100 | #342 | Tragic 94.0% |
| Immigrants | Mexico | 0.0 /100 | #343 | Tragic 93.9% |
| Immigrants | Guatemala | 0.0 /100 | #344 | Tragic 93.9% |
| Salvadorans | 0.0 /100 | #345 | Tragic 93.9% |
Demographics Similar to Moroccans by 6th Grade
In terms of 6th grade, the demographic groups most similar to Moroccans are Immigrants from Iraq (96.8%, a difference of 0.0%), Immigrants from Sudan (96.8%, a difference of 0.0%), Portuguese (96.8%, a difference of 0.010%), Sierra Leonean (96.8%, a difference of 0.010%), and Immigrants from Nepal (96.8%, a difference of 0.020%).
| Demographics | Rating | Rank | 6th Grade |
| Natives/Alaskans | 13.0 /100 | #205 | Poor 96.8% |
| Laotians | 11.8 /100 | #206 | Poor 96.8% |
| Iraqis | 11.7 /100 | #207 | Poor 96.8% |
| Samoans | 11.0 /100 | #208 | Poor 96.8% |
| Immigrants | Oceania | 11.0 /100 | #209 | Poor 96.8% |
| Immigrants | Nepal | 10.1 /100 | #210 | Poor 96.8% |
| Immigrants | Iraq | 9.2 /100 | #211 | Tragic 96.8% |
| Moroccans | 9.0 /100 | #212 | Tragic 96.8% |
| Immigrants | Sudan | 8.7 /100 | #213 | Tragic 96.8% |
| Portuguese | 8.2 /100 | #214 | Tragic 96.8% |
| Sierra Leoneans | 8.0 /100 | #215 | Tragic 96.8% |
| Paiute | 7.8 /100 | #216 | Tragic 96.8% |
| Liberians | 7.5 /100 | #217 | Tragic 96.8% |
| Navajo | 7.3 /100 | #218 | Tragic 96.8% |
| Costa Ricans | 6.8 /100 | #219 | Tragic 96.8% |