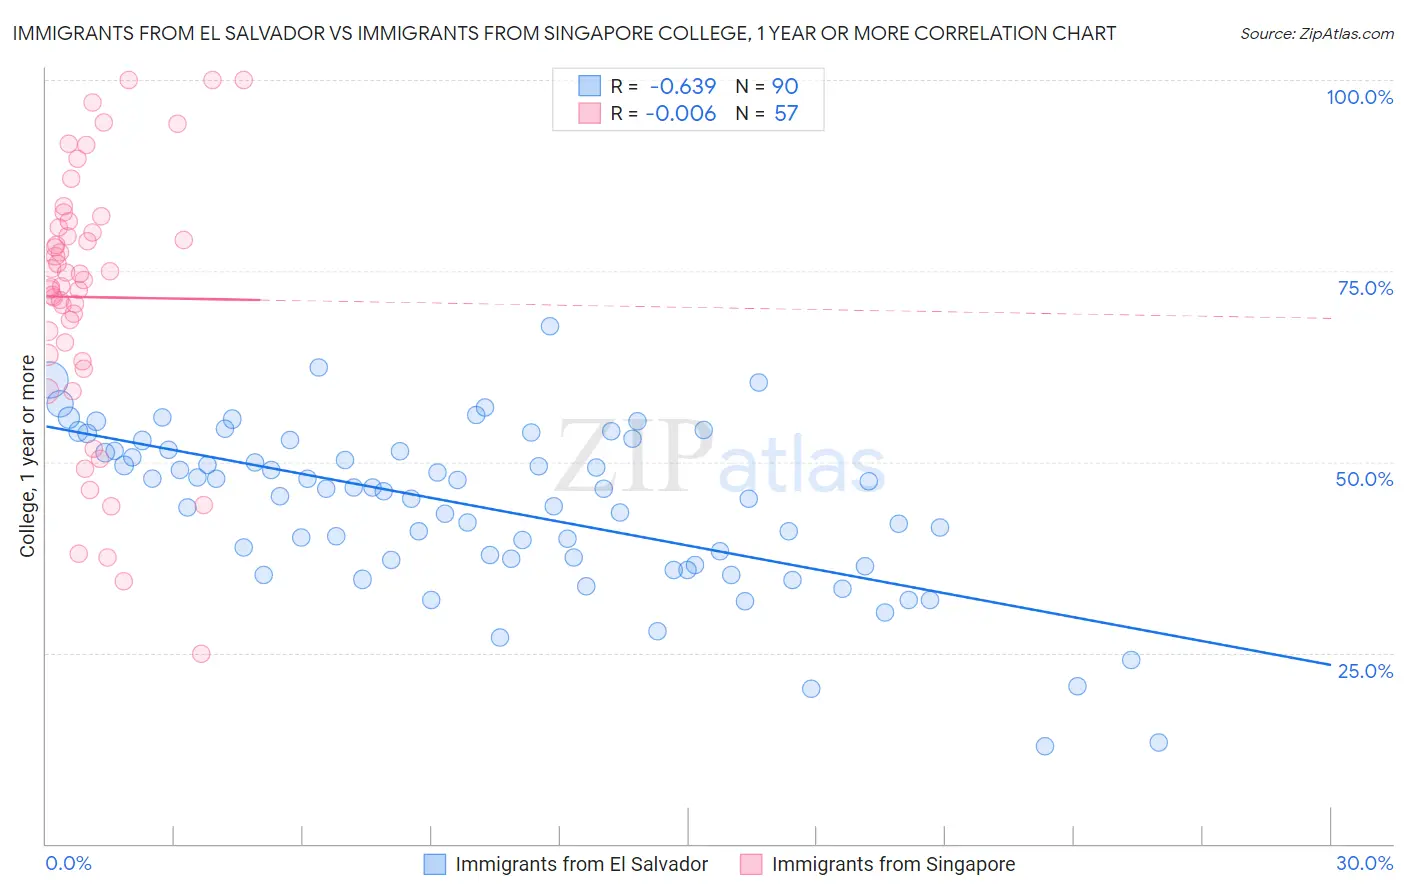
Immigrants from El Salvador vs Immigrants from Singapore College, 1 year or more
COMPARE
Immigrants from El Salvador
Immigrants from Singapore
College, 1 year or more
College, 1 year or more Comparison
Immigrants from El Salvador
Immigrants from Singapore
51.0%
COLLEGE, 1 YEAR OR MORE
0.0/ 100
METRIC RATING
319th/ 347
METRIC RANK
70.1%
COLLEGE, 1 YEAR OR MORE
100.0/ 100
METRIC RATING
2nd/ 347
METRIC RANK
Immigrants from El Salvador vs Immigrants from Singapore College, 1 year or more Correlation Chart
The statistical analysis conducted on geographies consisting of 357,850,135 people shows a significant negative correlation between the proportion of Immigrants from El Salvador and percentage of population with at least college, 1 year or more education in the United States with a correlation coefficient (R) of -0.639 and weighted average of 51.0%. Similarly, the statistical analysis conducted on geographies consisting of 137,521,700 people shows no correlation between the proportion of Immigrants from Singapore and percentage of population with at least college, 1 year or more education in the United States with a correlation coefficient (R) of -0.006 and weighted average of 70.1%, a difference of 37.5%.
College, 1 year or more Correlation Summary
| Measurement | Immigrants from El Salvador | Immigrants from Singapore |
| Minimum | 12.7% | 24.9% |
| Maximum | 67.7% | 100.0% |
| Range | 55.1% | 75.1% |
| Mean | 44.0% | 71.6% |
| Median | 46.3% | 73.8% |
| Interquartile 25% (IQ1) | 37.2% | 63.6% |
| Interquartile 75% (IQ3) | 51.5% | 81.1% |
| Interquartile Range (IQR) | 14.3% | 17.5% |
| Standard Deviation (Sample) | 10.6% | 17.1% |
| Standard Deviation (Population) | 10.5% | 17.0% |
Similar Demographics by College, 1 year or more
Demographics Similar to Immigrants from El Salvador by College, 1 year or more
In terms of college, 1 year or more, the demographic groups most similar to Immigrants from El Salvador are Kiowa (51.0%, a difference of 0.060%), Immigrants from Honduras (51.0%, a difference of 0.090%), Hopi (50.9%, a difference of 0.19%), Hispanic or Latino (51.1%, a difference of 0.22%), and Cajun (51.2%, a difference of 0.31%).
| Demographics | Rating | Rank | College, 1 year or more |
| Pueblo | 0.0 /100 | #312 | Tragic 51.5% |
| Immigrants | Caribbean | 0.0 /100 | #313 | Tragic 51.4% |
| Fijians | 0.0 /100 | #314 | Tragic 51.3% |
| Guatemalans | 0.0 /100 | #315 | Tragic 51.2% |
| Cajuns | 0.0 /100 | #316 | Tragic 51.2% |
| Hispanics or Latinos | 0.0 /100 | #317 | Tragic 51.1% |
| Immigrants | Honduras | 0.0 /100 | #318 | Tragic 51.0% |
| Immigrants | El Salvador | 0.0 /100 | #319 | Tragic 51.0% |
| Kiowa | 0.0 /100 | #320 | Tragic 51.0% |
| Hopi | 0.0 /100 | #321 | Tragic 50.9% |
| Navajo | 0.0 /100 | #322 | Tragic 50.8% |
| Immigrants | Guatemala | 0.0 /100 | #323 | Tragic 50.7% |
| Immigrants | Cuba | 0.0 /100 | #324 | Tragic 50.7% |
| Immigrants | Latin America | 0.0 /100 | #325 | Tragic 50.7% |
| Dominicans | 0.0 /100 | #326 | Tragic 50.6% |
Demographics Similar to Immigrants from Singapore by College, 1 year or more
In terms of college, 1 year or more, the demographic groups most similar to Immigrants from Singapore are Iranian (70.0%, a difference of 0.22%), Immigrants from Taiwan (69.6%, a difference of 0.72%), Immigrants from India (69.6%, a difference of 0.72%), Immigrants from Iran (69.5%, a difference of 0.92%), and Filipino (71.0%, a difference of 1.2%).
| Demographics | Rating | Rank | College, 1 year or more |
| Filipinos | 100.0 /100 | #1 | Exceptional 71.0% |
| Immigrants | Singapore | 100.0 /100 | #2 | Exceptional 70.1% |
| Iranians | 100.0 /100 | #3 | Exceptional 70.0% |
| Immigrants | Taiwan | 100.0 /100 | #4 | Exceptional 69.6% |
| Immigrants | India | 100.0 /100 | #5 | Exceptional 69.6% |
| Immigrants | Iran | 100.0 /100 | #6 | Exceptional 69.5% |
| Okinawans | 100.0 /100 | #7 | Exceptional 69.0% |
| Thais | 100.0 /100 | #8 | Exceptional 68.6% |
| Immigrants | Israel | 100.0 /100 | #9 | Exceptional 67.8% |
| Immigrants | Australia | 100.0 /100 | #10 | Exceptional 67.7% |
| Immigrants | South Central Asia | 100.0 /100 | #11 | Exceptional 67.1% |
| Cypriots | 100.0 /100 | #12 | Exceptional 67.0% |
| Immigrants | Sweden | 100.0 /100 | #13 | Exceptional 66.8% |
| Burmese | 100.0 /100 | #14 | Exceptional 66.7% |
| Cambodians | 100.0 /100 | #15 | Exceptional 66.7% |