Scandinavian vs Immigrants from Iraq 9th Grade
COMPARE
Scandinavian
Immigrants from Iraq
9th Grade
9th Grade Comparison
Scandinavians
Immigrants from Iraq
96.5%
9TH GRADE
100.0/ 100
METRIC RATING
18th/ 347
METRIC RANK
94.9%
9TH GRADE
47.8/ 100
METRIC RATING
177th/ 347
METRIC RANK
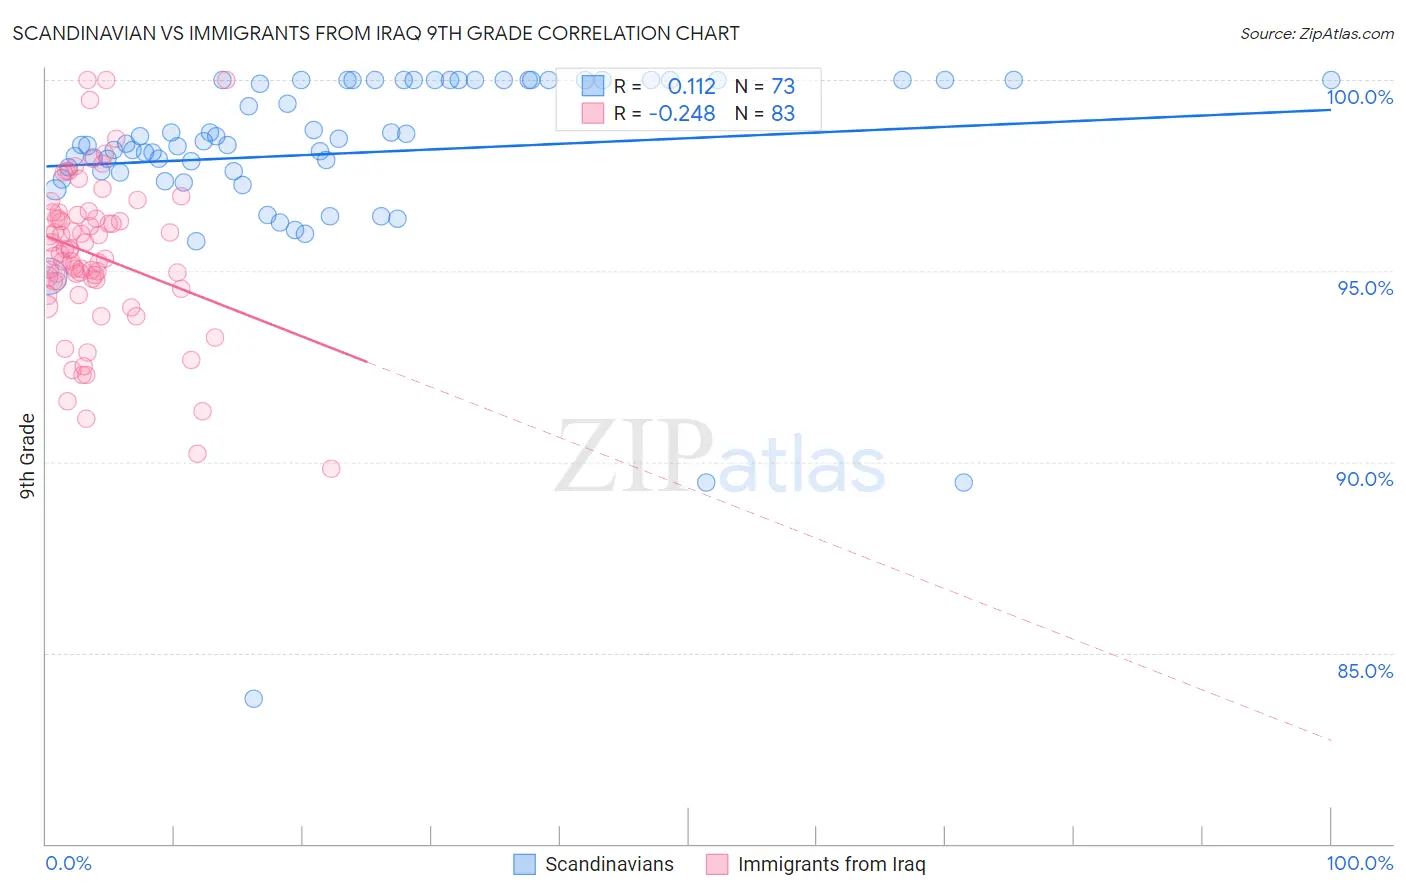
Scandinavian vs Immigrants from Iraq 9th Grade Correlation Chart
The statistical analysis conducted on geographies consisting of 472,660,435 people shows a poor positive correlation between the proportion of Scandinavians and percentage of population with at least 9th grade education in the United States with a correlation coefficient (R) of 0.112 and weighted average of 96.5%. Similarly, the statistical analysis conducted on geographies consisting of 194,632,332 people shows a weak negative correlation between the proportion of Immigrants from Iraq and percentage of population with at least 9th grade education in the United States with a correlation coefficient (R) of -0.248 and weighted average of 94.9%, a difference of 1.7%.
9th Grade Correlation Summary
| Measurement | Scandinavian | Immigrants from Iraq |
| Minimum | 83.8% | 89.8% |
| Maximum | 100.0% | 100.0% |
| Range | 16.2% | 10.2% |
| Mean | 98.1% | 95.4% |
| Median | 98.3% | 95.4% |
| Interquartile 25% (IQ1) | 97.6% | 94.7% |
| Interquartile 75% (IQ3) | 100.0% | 96.5% |
| Interquartile Range (IQR) | 2.4% | 1.7% |
| Standard Deviation (Sample) | 2.6% | 2.0% |
| Standard Deviation (Population) | 2.6% | 2.0% |
Similar Demographics by 9th Grade
Demographics Similar to Scandinavians by 9th Grade
In terms of 9th grade, the demographic groups most similar to Scandinavians are Dutch (96.5%, a difference of 0.020%), Welsh (96.4%, a difference of 0.040%), Italian (96.4%, a difference of 0.040%), Alaskan Athabascan (96.4%, a difference of 0.050%), and European (96.4%, a difference of 0.060%).
| Demographics | Rating | Rank | 9th Grade |
| Finns | 100.0 /100 | #11 | Exceptional 96.6% |
| English | 100.0 /100 | #12 | Exceptional 96.6% |
| Danes | 100.0 /100 | #13 | Exceptional 96.5% |
| Scottish | 100.0 /100 | #14 | Exceptional 96.5% |
| Irish | 100.0 /100 | #15 | Exceptional 96.5% |
| Croatians | 100.0 /100 | #16 | Exceptional 96.5% |
| Dutch | 100.0 /100 | #17 | Exceptional 96.5% |
| Scandinavians | 100.0 /100 | #18 | Exceptional 96.5% |
| Welsh | 100.0 /100 | #19 | Exceptional 96.4% |
| Italians | 100.0 /100 | #20 | Exceptional 96.4% |
| Alaskan Athabascans | 100.0 /100 | #21 | Exceptional 96.4% |
| Europeans | 100.0 /100 | #22 | Exceptional 96.4% |
| Czechs | 100.0 /100 | #23 | Exceptional 96.4% |
| Latvians | 100.0 /100 | #24 | Exceptional 96.4% |
| French | 100.0 /100 | #25 | Exceptional 96.3% |
Demographics Similar to Immigrants from Iraq by 9th Grade
In terms of 9th grade, the demographic groups most similar to Immigrants from Iraq are Brazilian (94.9%, a difference of 0.010%), Immigrants from Spain (94.9%, a difference of 0.010%), Immigrants from Poland (94.9%, a difference of 0.010%), Immigrants from Venezuela (94.9%, a difference of 0.010%), and Immigrants from Egypt (94.9%, a difference of 0.020%).
| Demographics | Rating | Rank | 9th Grade |
| Alsatians | 58.6 /100 | #170 | Average 94.9% |
| Colville | 58.5 /100 | #171 | Average 94.9% |
| Iraqis | 54.0 /100 | #172 | Average 94.9% |
| Cheyenne | 51.5 /100 | #173 | Average 94.9% |
| Immigrants | Egypt | 50.0 /100 | #174 | Average 94.9% |
| Brazilians | 49.8 /100 | #175 | Average 94.9% |
| Immigrants | Spain | 49.1 /100 | #176 | Average 94.9% |
| Immigrants | Iraq | 47.8 /100 | #177 | Average 94.9% |
| Immigrants | Poland | 46.7 /100 | #178 | Average 94.9% |
| Immigrants | Venezuela | 46.5 /100 | #179 | Average 94.9% |
| Immigrants | Uganda | 43.1 /100 | #180 | Average 94.8% |
| Sierra Leoneans | 42.7 /100 | #181 | Average 94.8% |
| Seminole | 42.5 /100 | #182 | Average 94.8% |
| Immigrants | Nepal | 39.7 /100 | #183 | Fair 94.8% |
| Argentineans | 37.6 /100 | #184 | Fair 94.8% |