Alaskan Athabascan vs Immigrants from England High School Diploma
COMPARE
Alaskan Athabascan
Immigrants from England
High School Diploma
High School Diploma Comparison
Alaskan Athabascans
Immigrants from England
90.9%
HIGH SCHOOL DIPLOMA
99.4/ 100
METRIC RATING
71st/ 347
METRIC RANK
90.8%
HIGH SCHOOL DIPLOMA
99.3/ 100
METRIC RATING
80th/ 347
METRIC RANK
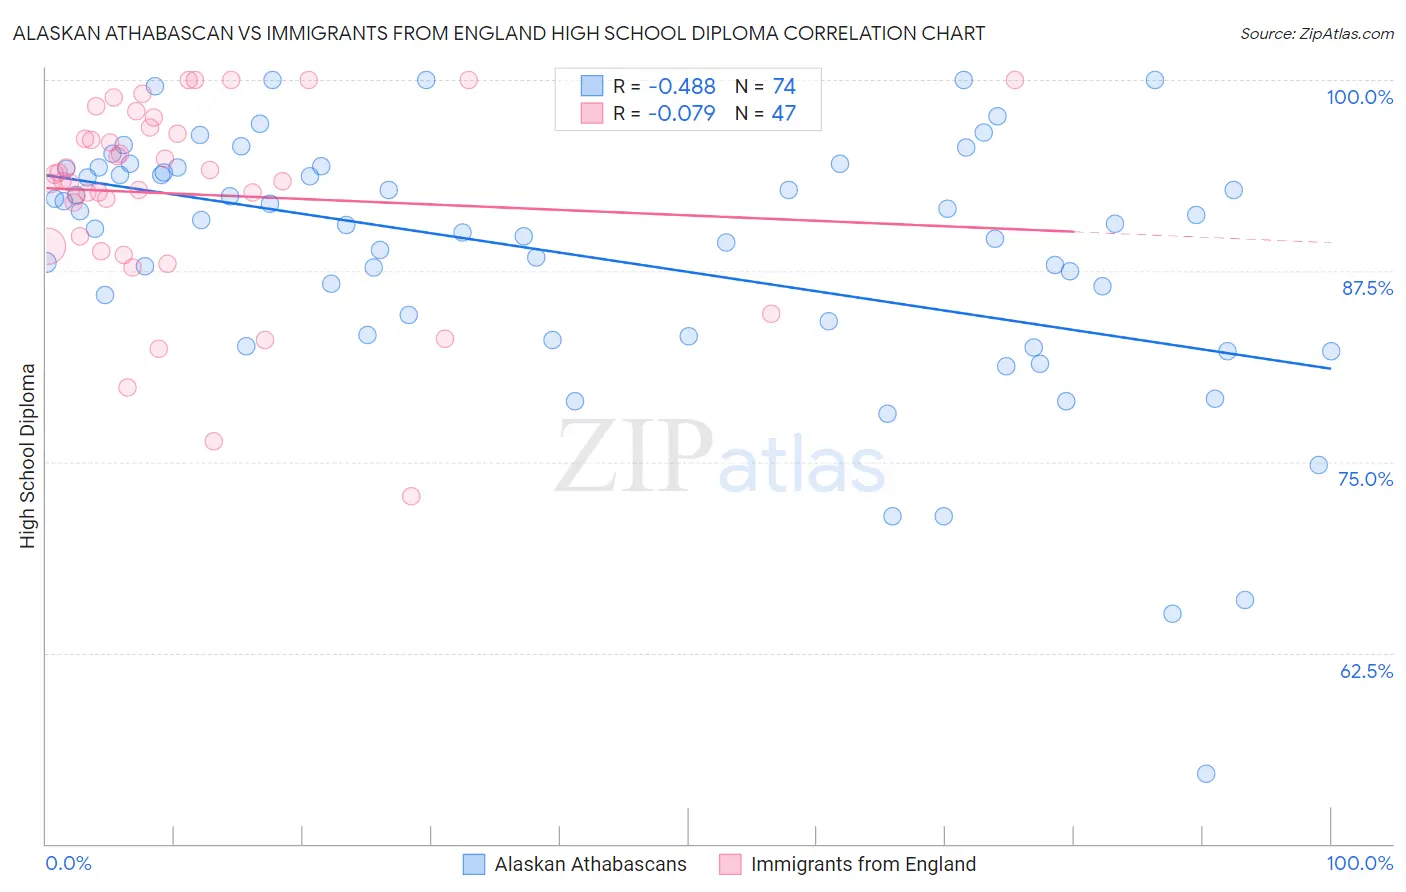
Alaskan Athabascan vs Immigrants from England High School Diploma Correlation Chart
The statistical analysis conducted on geographies consisting of 45,820,221 people shows a moderate negative correlation between the proportion of Alaskan Athabascans and percentage of population with at least high school diploma education in the United States with a correlation coefficient (R) of -0.488 and weighted average of 90.9%. Similarly, the statistical analysis conducted on geographies consisting of 391,897,700 people shows a slight negative correlation between the proportion of Immigrants from England and percentage of population with at least high school diploma education in the United States with a correlation coefficient (R) of -0.079 and weighted average of 90.8%, a difference of 0.10%.
High School Diploma Correlation Summary
| Measurement | Alaskan Athabascan | Immigrants from England |
| Minimum | 54.5% | 72.7% |
| Maximum | 100.0% | 100.0% |
| Range | 45.5% | 27.3% |
| Mean | 88.4% | 92.5% |
| Median | 90.5% | 93.4% |
| Interquartile 25% (IQ1) | 83.3% | 89.1% |
| Interquartile 75% (IQ3) | 94.2% | 96.9% |
| Interquartile Range (IQR) | 10.9% | 7.8% |
| Standard Deviation (Sample) | 8.6% | 6.4% |
| Standard Deviation (Population) | 8.5% | 6.3% |
Demographics Similar to Alaskan Athabascans and Immigrants from England by High School Diploma
In terms of high school diploma, the demographic groups most similar to Alaskan Athabascans are Immigrants from Latvia (90.9%, a difference of 0.0%), Soviet Union (90.9%, a difference of 0.0%), French Canadian (90.9%, a difference of 0.010%), Immigrants from South Central Asia (90.9%, a difference of 0.030%), and Czechoslovakian (90.9%, a difference of 0.040%). Similarly, the demographic groups most similar to Immigrants from England are Immigrants from Switzerland (90.8%, a difference of 0.0%), Immigrants from Denmark (90.8%, a difference of 0.010%), Native Hawaiian (90.8%, a difference of 0.020%), Burmese (90.8%, a difference of 0.020%), and Hungarian (90.8%, a difference of 0.030%).
| Demographics | Rating | Rank | High School Diploma |
| Immigrants | South Africa | 99.6 /100 | #65 | Exceptional 91.0% |
| French | 99.5 /100 | #66 | Exceptional 91.0% |
| Immigrants | Iran | 99.5 /100 | #67 | Exceptional 90.9% |
| Czechoslovakians | 99.5 /100 | #68 | Exceptional 90.9% |
| French Canadians | 99.5 /100 | #69 | Exceptional 90.9% |
| Immigrants | Latvia | 99.5 /100 | #70 | Exceptional 90.9% |
| Alaskan Athabascans | 99.4 /100 | #71 | Exceptional 90.9% |
| Soviet Union | 99.4 /100 | #72 | Exceptional 90.9% |
| Immigrants | South Central Asia | 99.4 /100 | #73 | Exceptional 90.9% |
| Immigrants | Czechoslovakia | 99.4 /100 | #74 | Exceptional 90.9% |
| Cambodians | 99.4 /100 | #75 | Exceptional 90.8% |
| Hungarians | 99.3 /100 | #76 | Exceptional 90.8% |
| Native Hawaiians | 99.3 /100 | #77 | Exceptional 90.8% |
| Burmese | 99.3 /100 | #78 | Exceptional 90.8% |
| Immigrants | Denmark | 99.3 /100 | #79 | Exceptional 90.8% |
| Immigrants | England | 99.3 /100 | #80 | Exceptional 90.8% |
| Immigrants | Switzerland | 99.3 /100 | #81 | Exceptional 90.8% |
| Scotch-Irish | 99.2 /100 | #82 | Exceptional 90.8% |
| Immigrants | Moldova | 99.2 /100 | #83 | Exceptional 90.7% |
| Immigrants | Saudi Arabia | 99.1 /100 | #84 | Exceptional 90.7% |
| Romanians | 98.9 /100 | #85 | Exceptional 90.7% |