Immigrants from Bolivia vs Immigrants from South America 4th Grade
COMPARE
Immigrants from Bolivia
Immigrants from South America
4th Grade
4th Grade Comparison
Immigrants from Bolivia
Immigrants from South America
96.9%
4TH GRADE
0.1/ 100
METRIC RATING
278th/ 347
METRIC RANK
97.0%
4TH GRADE
0.4/ 100
METRIC RATING
261st/ 347
METRIC RANK
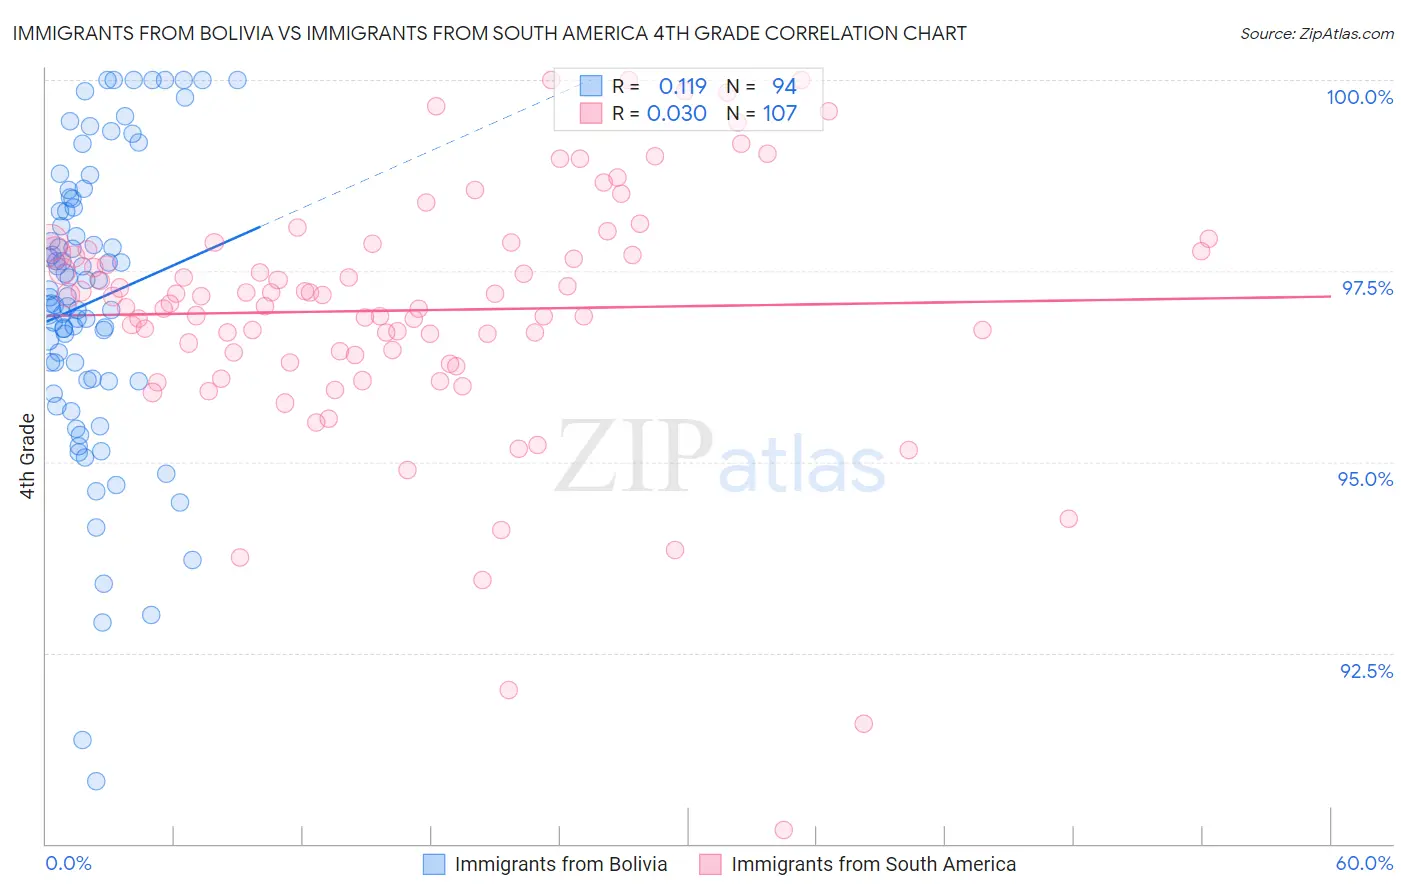
Immigrants from Bolivia vs Immigrants from South America 4th Grade Correlation Chart
The statistical analysis conducted on geographies consisting of 158,719,812 people shows a poor positive correlation between the proportion of Immigrants from Bolivia and percentage of population with at least 4th grade education in the United States with a correlation coefficient (R) of 0.119 and weighted average of 96.9%. Similarly, the statistical analysis conducted on geographies consisting of 486,429,719 people shows no correlation between the proportion of Immigrants from South America and percentage of population with at least 4th grade education in the United States with a correlation coefficient (R) of 0.030 and weighted average of 97.0%, a difference of 0.13%.
4th Grade Correlation Summary
| Measurement | Immigrants from Bolivia | Immigrants from South America |
| Minimum | 90.8% | 90.2% |
| Maximum | 100.0% | 100.0% |
| Range | 9.2% | 9.8% |
| Mean | 97.1% | 97.0% |
| Median | 97.2% | 97.2% |
| Interquartile 25% (IQ1) | 96.1% | 96.4% |
| Interquartile 75% (IQ3) | 98.3% | 97.8% |
| Interquartile Range (IQR) | 2.3% | 1.4% |
| Standard Deviation (Sample) | 1.9% | 1.7% |
| Standard Deviation (Population) | 1.9% | 1.6% |
Demographics Similar to Immigrants from Bolivia and Immigrants from South America by 4th Grade
In terms of 4th grade, the demographic groups most similar to Immigrants from Bolivia are Immigrants from Western Africa (96.9%, a difference of 0.0%), Immigrants from Ghana (96.9%, a difference of 0.010%), Yaqui (96.9%, a difference of 0.010%), Afghan (96.9%, a difference of 0.010%), and Trinidadian and Tobagonian (96.9%, a difference of 0.020%). Similarly, the demographic groups most similar to Immigrants from South America are Immigrants from Sierra Leone (97.0%, a difference of 0.0%), West Indian (97.0%, a difference of 0.010%), Immigrants from Jamaica (97.0%, a difference of 0.010%), Immigrants from Ethiopia (97.0%, a difference of 0.020%), and Taiwanese (97.0%, a difference of 0.020%).
| Demographics | Rating | Rank | 4th Grade |
| Immigrants | Ethiopia | 0.4 /100 | #259 | Tragic 97.0% |
| Immigrants | Sierra Leone | 0.4 /100 | #260 | Tragic 97.0% |
| Immigrants | South America | 0.4 /100 | #261 | Tragic 97.0% |
| West Indians | 0.4 /100 | #262 | Tragic 97.0% |
| Immigrants | Jamaica | 0.3 /100 | #263 | Tragic 97.0% |
| Taiwanese | 0.3 /100 | #264 | Tragic 97.0% |
| Armenians | 0.3 /100 | #265 | Tragic 97.0% |
| Immigrants | China | 0.3 /100 | #266 | Tragic 97.0% |
| Immigrants | Nigeria | 0.3 /100 | #267 | Tragic 97.0% |
| Ghanaians | 0.2 /100 | #268 | Tragic 97.0% |
| Immigrants | Uzbekistan | 0.2 /100 | #269 | Tragic 96.9% |
| Cubans | 0.2 /100 | #270 | Tragic 96.9% |
| Immigrants | Peru | 0.1 /100 | #271 | Tragic 96.9% |
| Fijians | 0.1 /100 | #272 | Tragic 96.9% |
| Immigrants | Cameroon | 0.1 /100 | #273 | Tragic 96.9% |
| Trinidadians and Tobagonians | 0.1 /100 | #274 | Tragic 96.9% |
| Immigrants | Ghana | 0.1 /100 | #275 | Tragic 96.9% |
| Yaqui | 0.1 /100 | #276 | Tragic 96.9% |
| Immigrants | Western Africa | 0.1 /100 | #277 | Tragic 96.9% |
| Immigrants | Bolivia | 0.1 /100 | #278 | Tragic 96.9% |
| Afghans | 0.1 /100 | #279 | Tragic 96.9% |