Salvadoran vs Apache Bachelor's Degree
COMPARE
Salvadoran
Apache
Bachelor's Degree
Bachelor's Degree Comparison
Salvadorans
Apache
31.8%
BACHELOR'S DEGREE
0.1/ 100
METRIC RATING
276th/ 347
METRIC RANK
28.3%
BACHELOR'S DEGREE
0.0/ 100
METRIC RATING
326th/ 347
METRIC RANK
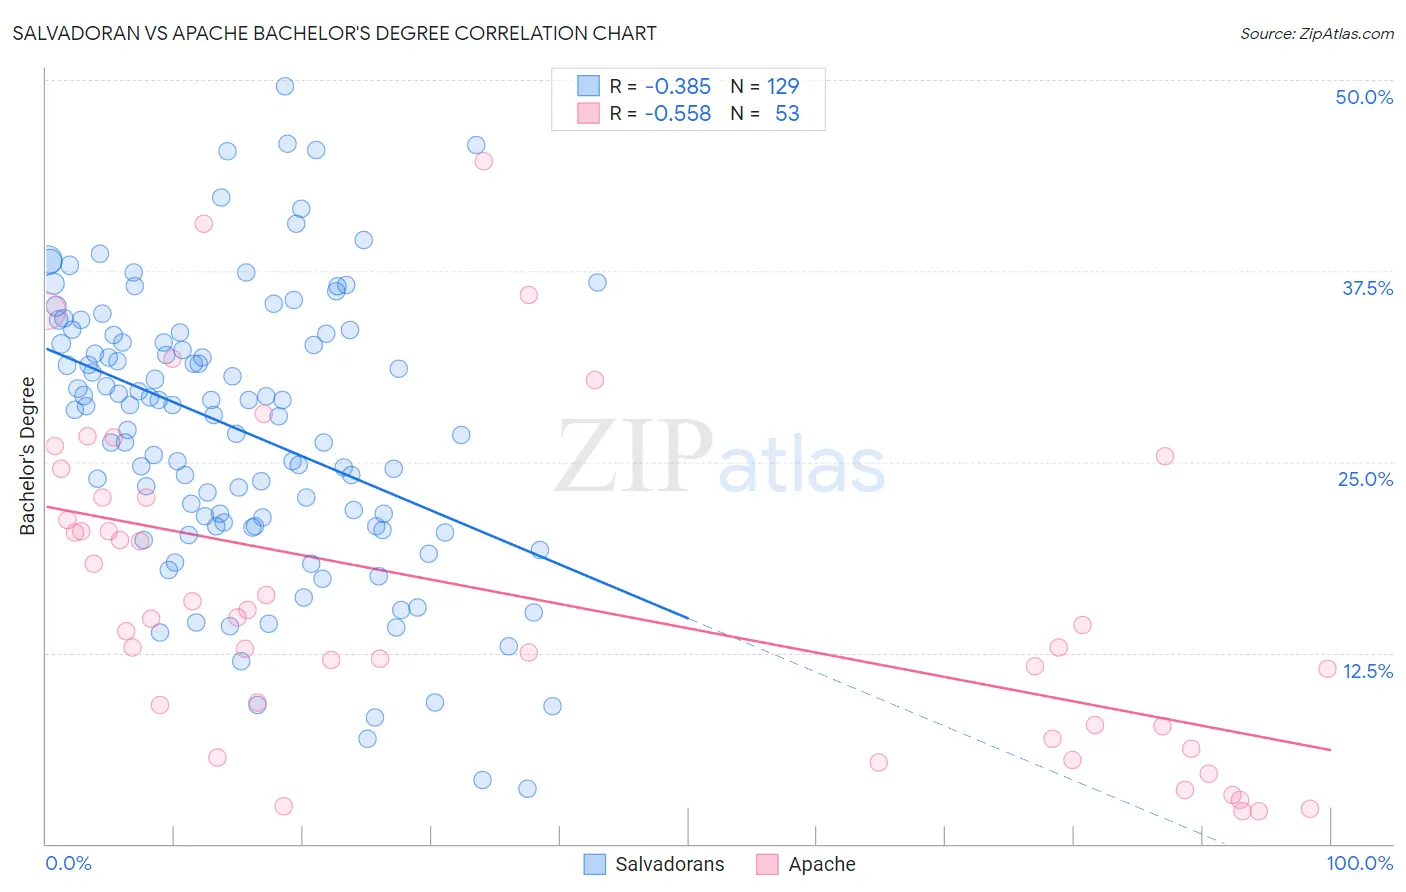
Salvadoran vs Apache Bachelor's Degree Correlation Chart
The statistical analysis conducted on geographies consisting of 399,013,462 people shows a mild negative correlation between the proportion of Salvadorans and percentage of population with at least bachelor's degree education in the United States with a correlation coefficient (R) of -0.385 and weighted average of 31.8%. Similarly, the statistical analysis conducted on geographies consisting of 231,132,422 people shows a substantial negative correlation between the proportion of Apache and percentage of population with at least bachelor's degree education in the United States with a correlation coefficient (R) of -0.558 and weighted average of 28.3%, a difference of 12.5%.
Bachelor's Degree Correlation Summary
| Measurement | Salvadoran | Apache |
| Minimum | 3.6% | 2.1% |
| Maximum | 49.6% | 44.7% |
| Range | 46.0% | 42.5% |
| Mean | 27.1% | 16.1% |
| Median | 28.7% | 14.3% |
| Interquartile 25% (IQ1) | 20.8% | 7.3% |
| Interquartile 75% (IQ3) | 33.3% | 22.7% |
| Interquartile Range (IQR) | 12.5% | 15.4% |
| Standard Deviation (Sample) | 9.2% | 10.5% |
| Standard Deviation (Population) | 9.2% | 10.4% |
Similar Demographics by Bachelor's Degree
Demographics Similar to Salvadorans by Bachelor's Degree
In terms of bachelor's degree, the demographic groups most similar to Salvadorans are Samoan (31.8%, a difference of 0.040%), Dominican (31.8%, a difference of 0.15%), Potawatomi (31.9%, a difference of 0.17%), American (31.9%, a difference of 0.19%), and Marshallese (31.7%, a difference of 0.20%).
| Demographics | Rating | Rank | Bachelor's Degree |
| Immigrants | Belize | 0.2 /100 | #269 | Tragic 32.1% |
| Immigrants | Nicaragua | 0.2 /100 | #270 | Tragic 31.9% |
| Central Americans | 0.2 /100 | #271 | Tragic 31.9% |
| Comanche | 0.2 /100 | #272 | Tragic 31.9% |
| Americans | 0.2 /100 | #273 | Tragic 31.9% |
| Potawatomi | 0.2 /100 | #274 | Tragic 31.9% |
| Samoans | 0.1 /100 | #275 | Tragic 31.8% |
| Salvadorans | 0.1 /100 | #276 | Tragic 31.8% |
| Dominicans | 0.1 /100 | #277 | Tragic 31.8% |
| Marshallese | 0.1 /100 | #278 | Tragic 31.7% |
| Hawaiians | 0.1 /100 | #279 | Tragic 31.6% |
| Immigrants | Laos | 0.1 /100 | #280 | Tragic 31.6% |
| Blackfeet | 0.1 /100 | #281 | Tragic 31.5% |
| Immigrants | Caribbean | 0.1 /100 | #282 | Tragic 31.4% |
| Hondurans | 0.1 /100 | #283 | Tragic 31.3% |
Demographics Similar to Apache by Bachelor's Degree
In terms of bachelor's degree, the demographic groups most similar to Apache are Pennsylvania German (28.4%, a difference of 0.39%), Paiute (28.1%, a difference of 0.67%), Dutch West Indian (28.5%, a difference of 0.84%), Fijian (28.7%, a difference of 1.6%), and Tsimshian (28.8%, a difference of 1.7%).
| Demographics | Rating | Rank | Bachelor's Degree |
| Creek | 0.0 /100 | #319 | Tragic 28.9% |
| Kiowa | 0.0 /100 | #320 | Tragic 28.8% |
| Alaskan Athabascans | 0.0 /100 | #321 | Tragic 28.8% |
| Tsimshian | 0.0 /100 | #322 | Tragic 28.8% |
| Fijians | 0.0 /100 | #323 | Tragic 28.7% |
| Dutch West Indians | 0.0 /100 | #324 | Tragic 28.5% |
| Pennsylvania Germans | 0.0 /100 | #325 | Tragic 28.4% |
| Apache | 0.0 /100 | #326 | Tragic 28.3% |
| Paiute | 0.0 /100 | #327 | Tragic 28.1% |
| Crow | 0.0 /100 | #328 | Tragic 27.7% |
| Immigrants | Central America | 0.0 /100 | #329 | Tragic 27.5% |
| Spanish American Indians | 0.0 /100 | #330 | Tragic 27.5% |
| Immigrants | Azores | 0.0 /100 | #331 | Tragic 27.3% |
| Menominee | 0.0 /100 | #332 | Tragic 27.3% |
| Mexicans | 0.0 /100 | #333 | Tragic 27.1% |