Immigrants from Eastern Asia vs Navajo 6th Grade
COMPARE
Immigrants from Eastern Asia
Navajo
6th Grade
6th Grade Comparison
Immigrants from Eastern Asia
Navajo
96.7%
6TH GRADE
4.0/ 100
METRIC RATING
230th/ 347
METRIC RANK
96.8%
6TH GRADE
7.3/ 100
METRIC RATING
218th/ 347
METRIC RANK
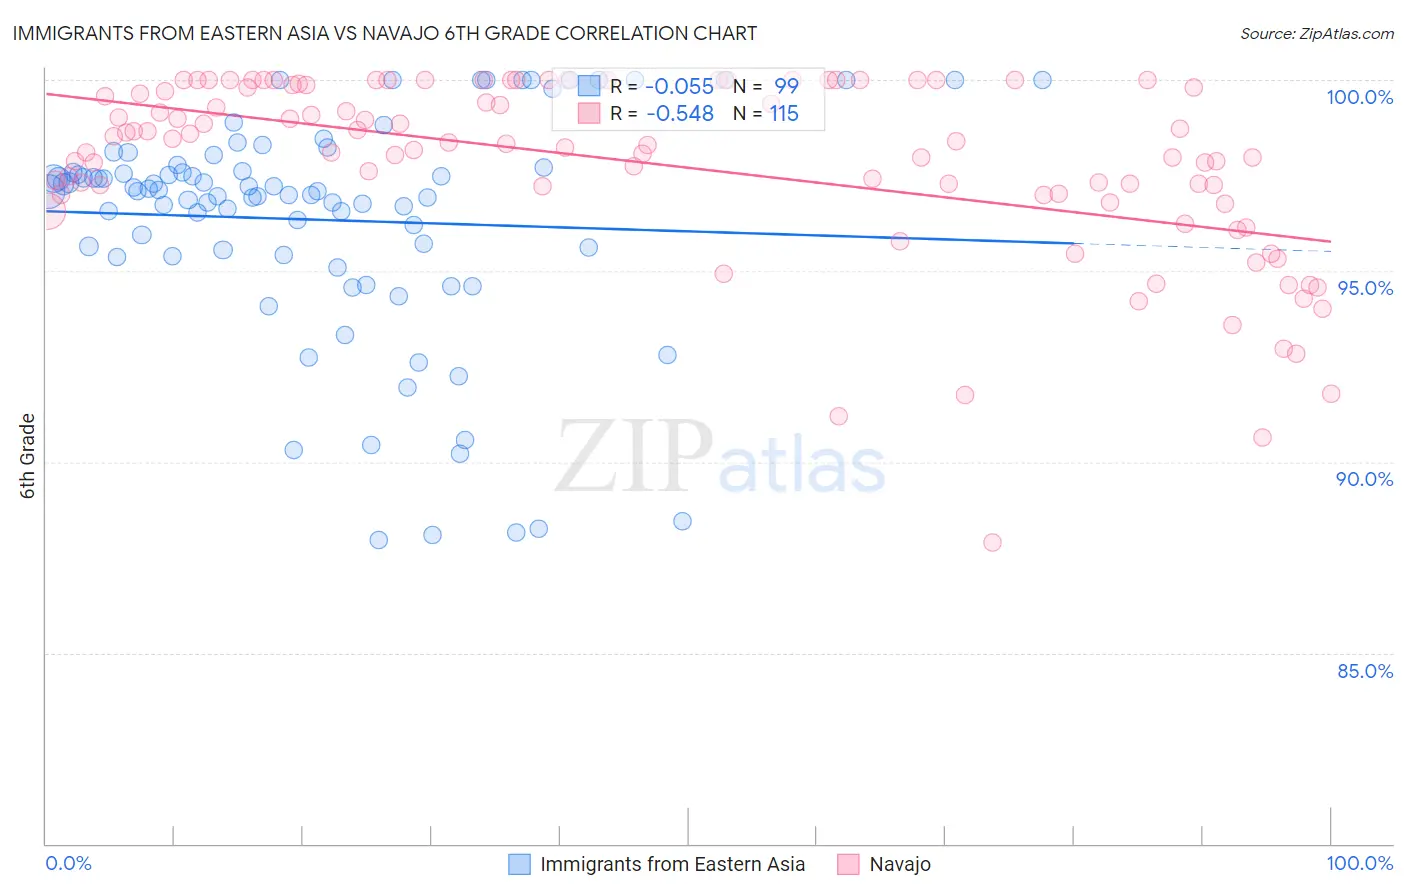
Immigrants from Eastern Asia vs Navajo 6th Grade Correlation Chart
The statistical analysis conducted on geographies consisting of 499,865,893 people shows a slight negative correlation between the proportion of Immigrants from Eastern Asia and percentage of population with at least 6th grade education in the United States with a correlation coefficient (R) of -0.055 and weighted average of 96.7%. Similarly, the statistical analysis conducted on geographies consisting of 224,872,927 people shows a substantial negative correlation between the proportion of Navajo and percentage of population with at least 6th grade education in the United States with a correlation coefficient (R) of -0.548 and weighted average of 96.8%, a difference of 0.070%.
6th Grade Correlation Summary
| Measurement | Immigrants from Eastern Asia | Navajo |
| Minimum | 88.0% | 87.9% |
| Maximum | 100.0% | 100.0% |
| Range | 12.0% | 12.1% |
| Mean | 96.3% | 97.8% |
| Median | 97.1% | 98.3% |
| Interquartile 25% (IQ1) | 95.4% | 97.0% |
| Interquartile 75% (IQ3) | 97.7% | 99.9% |
| Interquartile Range (IQR) | 2.3% | 2.9% |
| Standard Deviation (Sample) | 2.9% | 2.4% |
| Standard Deviation (Population) | 2.9% | 2.4% |
Demographics Similar to Immigrants from Eastern Asia and Navajo by 6th Grade
In terms of 6th grade, the demographic groups most similar to Immigrants from Eastern Asia are Immigrants from Western Asia (96.7%, a difference of 0.0%), Immigrants from Malaysia (96.7%, a difference of 0.0%), Assyrian/Chaldean/Syriac (96.7%, a difference of 0.0%), Immigrants from Southern Europe (96.7%, a difference of 0.010%), and Immigrants from Pakistan (96.7%, a difference of 0.010%). Similarly, the demographic groups most similar to Navajo are Liberian (96.8%, a difference of 0.0%), Sierra Leonean (96.8%, a difference of 0.010%), Paiute (96.8%, a difference of 0.010%), Costa Rican (96.8%, a difference of 0.010%), and Portuguese (96.8%, a difference of 0.020%).
| Demographics | Rating | Rank | 6th Grade |
| Portuguese | 8.2 /100 | #214 | Tragic 96.8% |
| Sierra Leoneans | 8.0 /100 | #215 | Tragic 96.8% |
| Paiute | 7.8 /100 | #216 | Tragic 96.8% |
| Liberians | 7.5 /100 | #217 | Tragic 96.8% |
| Navajo | 7.3 /100 | #218 | Tragic 96.8% |
| Costa Ricans | 6.8 /100 | #219 | Tragic 96.8% |
| Immigrants | Morocco | 6.2 /100 | #220 | Tragic 96.7% |
| Tongans | 6.1 /100 | #221 | Tragic 96.7% |
| Immigrants | Syria | 5.9 /100 | #222 | Tragic 96.7% |
| Bahamians | 4.8 /100 | #223 | Tragic 96.7% |
| Immigrants | Southern Europe | 4.4 /100 | #224 | Tragic 96.7% |
| Immigrants | Pakistan | 4.4 /100 | #225 | Tragic 96.7% |
| Immigrants | Panama | 4.2 /100 | #226 | Tragic 96.7% |
| Immigrants | Western Asia | 4.1 /100 | #227 | Tragic 96.7% |
| Immigrants | Malaysia | 4.0 /100 | #228 | Tragic 96.7% |
| Assyrians/Chaldeans/Syriacs | 4.0 /100 | #229 | Tragic 96.7% |
| Immigrants | Eastern Asia | 4.0 /100 | #230 | Tragic 96.7% |
| Sub-Saharan Africans | 3.5 /100 | #231 | Tragic 96.7% |
| South American Indians | 3.5 /100 | #232 | Tragic 96.7% |
| Yuman | 3.2 /100 | #233 | Tragic 96.7% |
| Uruguayans | 2.5 /100 | #234 | Tragic 96.6% |