Apache vs Immigrants from Netherlands 8th Grade
COMPARE
Apache
Immigrants from Netherlands
8th Grade
8th Grade Comparison
Apache
Immigrants from Netherlands
95.5%
8TH GRADE
19.4/ 100
METRIC RATING
202nd/ 347
METRIC RANK
96.5%
8TH GRADE
99.4/ 100
METRIC RATING
76th/ 347
METRIC RANK
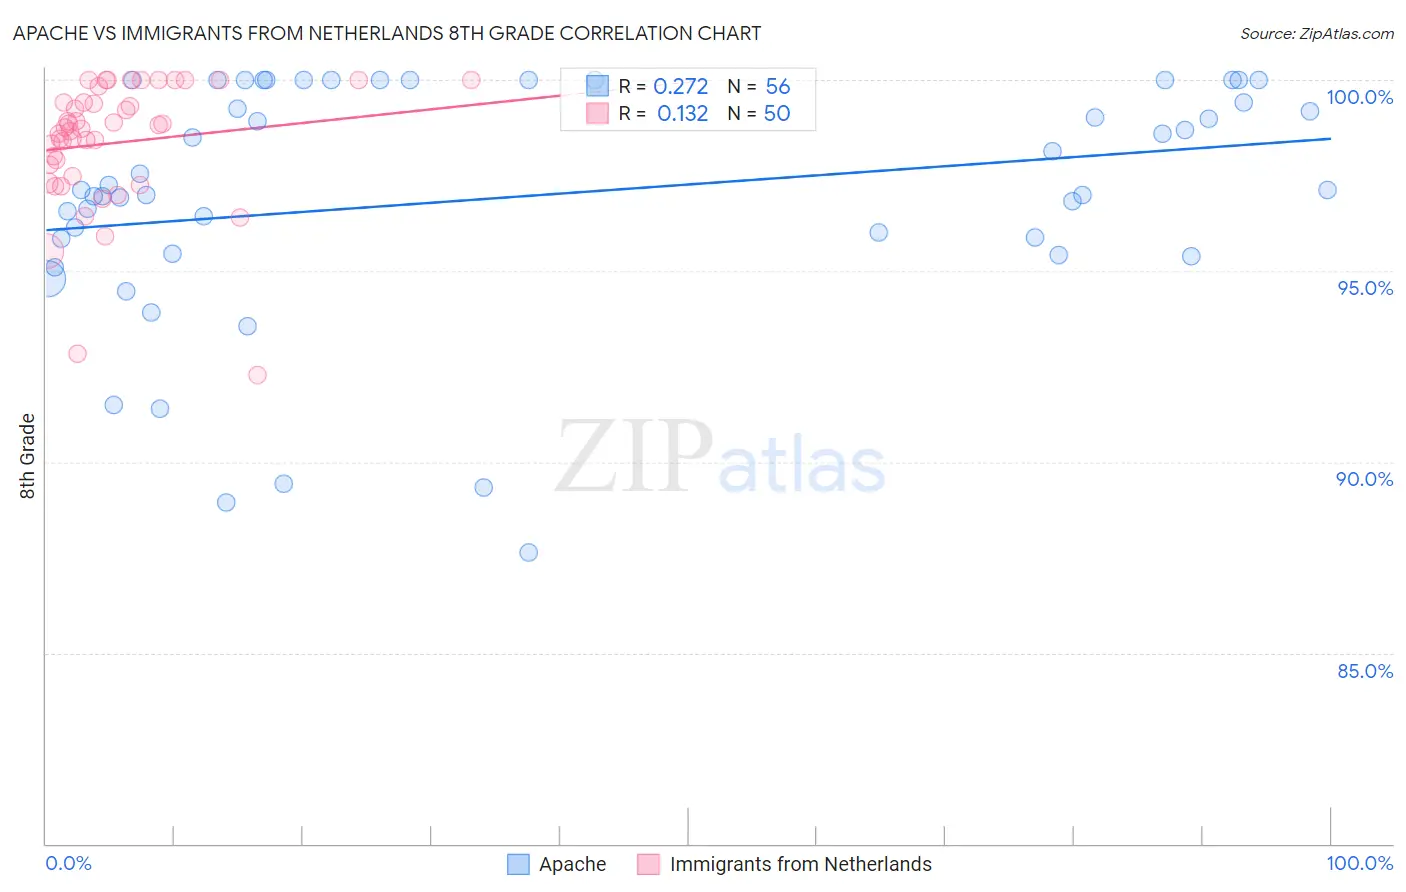
Apache vs Immigrants from Netherlands 8th Grade Correlation Chart
The statistical analysis conducted on geographies consisting of 231,143,094 people shows a weak positive correlation between the proportion of Apache and percentage of population with at least 8th grade education in the United States with a correlation coefficient (R) of 0.272 and weighted average of 95.5%. Similarly, the statistical analysis conducted on geographies consisting of 237,869,934 people shows a poor positive correlation between the proportion of Immigrants from Netherlands and percentage of population with at least 8th grade education in the United States with a correlation coefficient (R) of 0.132 and weighted average of 96.5%, a difference of 1.1%.
8th Grade Correlation Summary
| Measurement | Apache | Immigrants from Netherlands |
| Minimum | 87.6% | 92.3% |
| Maximum | 100.0% | 100.0% |
| Range | 12.4% | 7.7% |
| Mean | 96.9% | 98.4% |
| Median | 97.1% | 98.7% |
| Interquartile 25% (IQ1) | 95.7% | 97.5% |
| Interquartile 75% (IQ3) | 100.0% | 99.4% |
| Interquartile Range (IQR) | 4.3% | 1.9% |
| Standard Deviation (Sample) | 3.2% | 1.7% |
| Standard Deviation (Population) | 3.1% | 1.7% |
Similar Demographics by 8th Grade
Demographics Similar to Apache by 8th Grade
In terms of 8th grade, the demographic groups most similar to Apache are Immigrants from Argentina (95.5%, a difference of 0.010%), Moroccan (95.5%, a difference of 0.020%), Paraguayan (95.5%, a difference of 0.030%), Immigrants from Northern Africa (95.5%, a difference of 0.030%), and Argentinean (95.5%, a difference of 0.030%).
| Demographics | Rating | Rank | 8th Grade |
| Immigrants | Zaire | 25.2 /100 | #195 | Fair 95.6% |
| Assyrians/Chaldeans/Syriacs | 24.5 /100 | #196 | Fair 95.6% |
| Sierra Leoneans | 24.3 /100 | #197 | Fair 95.6% |
| Paraguayans | 22.6 /100 | #198 | Fair 95.5% |
| Immigrants | Northern Africa | 22.5 /100 | #199 | Fair 95.5% |
| Argentineans | 22.2 /100 | #200 | Fair 95.5% |
| Immigrants | Argentina | 20.6 /100 | #201 | Fair 95.5% |
| Apache | 19.4 /100 | #202 | Poor 95.5% |
| Moroccans | 17.4 /100 | #203 | Poor 95.5% |
| Hawaiians | 16.7 /100 | #204 | Poor 95.5% |
| Immigrants | Bahamas | 16.7 /100 | #205 | Poor 95.5% |
| Comanche | 16.3 /100 | #206 | Poor 95.5% |
| Immigrants | Sudan | 15.1 /100 | #207 | Poor 95.5% |
| Portuguese | 14.3 /100 | #208 | Poor 95.5% |
| Immigrants | Lebanon | 13.7 /100 | #209 | Poor 95.4% |
Demographics Similar to Immigrants from Netherlands by 8th Grade
In terms of 8th grade, the demographic groups most similar to Immigrants from Netherlands are Zimbabwean (96.5%, a difference of 0.0%), Cypriot (96.5%, a difference of 0.0%), Immigrants from Ireland (96.5%, a difference of 0.010%), Yugoslavian (96.5%, a difference of 0.010%), and New Zealander (96.6%, a difference of 0.020%).
| Demographics | Rating | Rank | 8th Grade |
| Americans | 99.7 /100 | #69 | Exceptional 96.6% |
| Immigrants | Lithuania | 99.6 /100 | #70 | Exceptional 96.6% |
| New Zealanders | 99.5 /100 | #71 | Exceptional 96.6% |
| Immigrants | England | 99.5 /100 | #72 | Exceptional 96.6% |
| Arapaho | 99.5 /100 | #73 | Exceptional 96.6% |
| Immigrants | Ireland | 99.5 /100 | #74 | Exceptional 96.5% |
| Zimbabweans | 99.4 /100 | #75 | Exceptional 96.5% |
| Immigrants | Netherlands | 99.4 /100 | #76 | Exceptional 96.5% |
| Cypriots | 99.4 /100 | #77 | Exceptional 96.5% |
| Yugoslavians | 99.4 /100 | #78 | Exceptional 96.5% |
| Puget Sound Salish | 99.3 /100 | #79 | Exceptional 96.5% |
| Delaware | 99.2 /100 | #80 | Exceptional 96.5% |
| Romanians | 99.2 /100 | #81 | Exceptional 96.5% |
| Turks | 99.2 /100 | #82 | Exceptional 96.5% |
| Icelanders | 99.2 /100 | #83 | Exceptional 96.5% |