Lebanese vs Immigrants from Netherlands 8th Grade
COMPARE
Lebanese
Immigrants from Netherlands
8th Grade
8th Grade Comparison
Lebanese
Immigrants from Netherlands
96.3%
8TH GRADE
97.5/ 100
METRIC RATING
108th/ 347
METRIC RANK
96.5%
8TH GRADE
99.4/ 100
METRIC RATING
76th/ 347
METRIC RANK
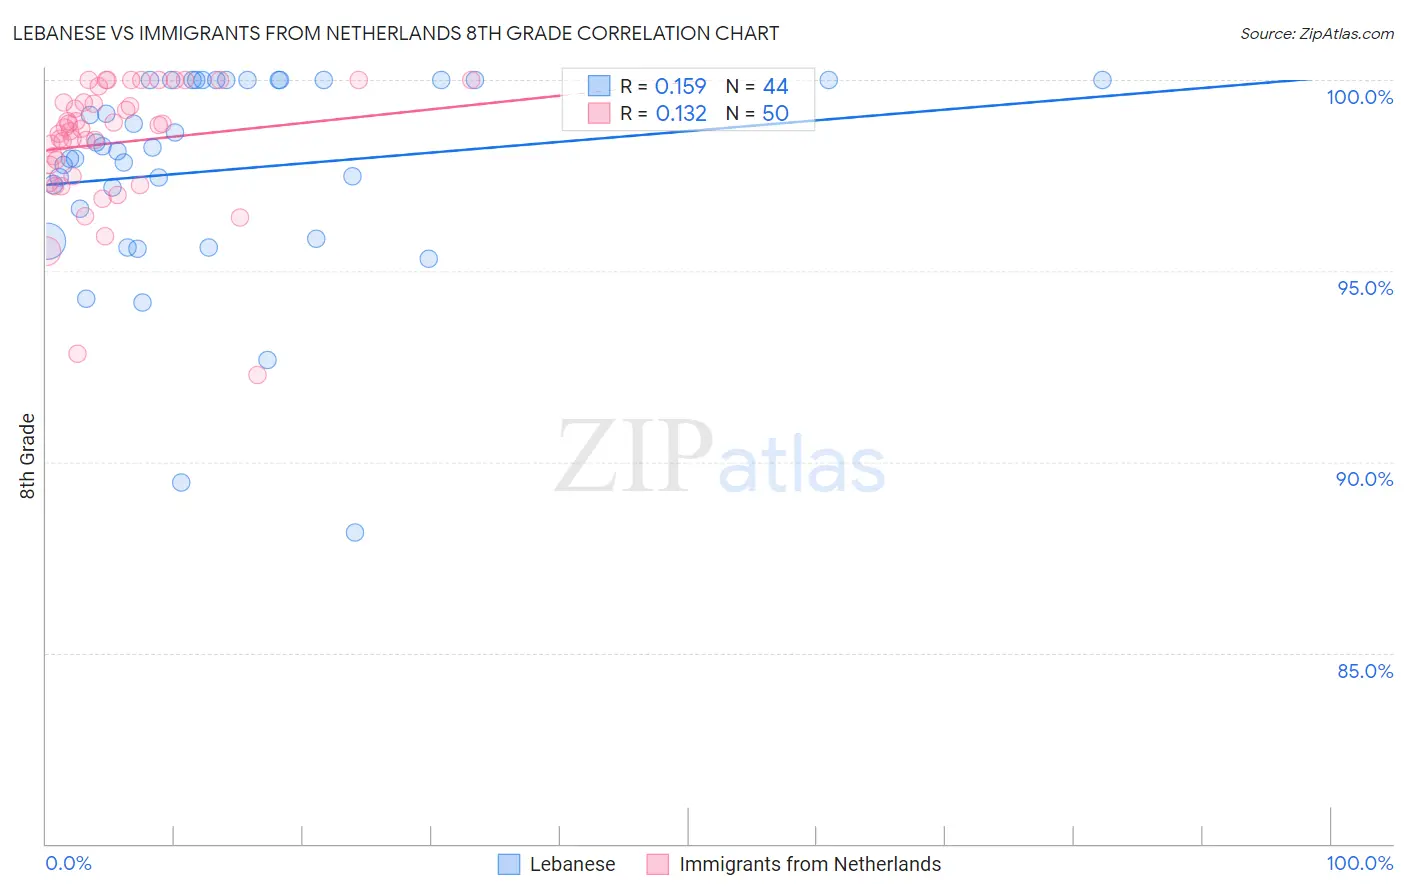
Lebanese vs Immigrants from Netherlands 8th Grade Correlation Chart
The statistical analysis conducted on geographies consisting of 401,624,157 people shows a poor positive correlation between the proportion of Lebanese and percentage of population with at least 8th grade education in the United States with a correlation coefficient (R) of 0.159 and weighted average of 96.3%. Similarly, the statistical analysis conducted on geographies consisting of 237,869,934 people shows a poor positive correlation between the proportion of Immigrants from Netherlands and percentage of population with at least 8th grade education in the United States with a correlation coefficient (R) of 0.132 and weighted average of 96.5%, a difference of 0.23%.
8th Grade Correlation Summary
| Measurement | Lebanese | Immigrants from Netherlands |
| Minimum | 88.2% | 92.3% |
| Maximum | 100.0% | 100.0% |
| Range | 11.8% | 7.7% |
| Mean | 97.6% | 98.4% |
| Median | 98.2% | 98.7% |
| Interquartile 25% (IQ1) | 96.2% | 97.5% |
| Interquartile 75% (IQ3) | 100.0% | 99.4% |
| Interquartile Range (IQR) | 3.8% | 1.9% |
| Standard Deviation (Sample) | 2.7% | 1.7% |
| Standard Deviation (Population) | 2.7% | 1.7% |
Similar Demographics by 8th Grade
Demographics Similar to Lebanese by 8th Grade
In terms of 8th grade, the demographic groups most similar to Lebanese are Iroquois (96.3%, a difference of 0.0%), Immigrants from Latvia (96.3%, a difference of 0.020%), Immigrants from Saudi Arabia (96.3%, a difference of 0.030%), Kiowa (96.3%, a difference of 0.030%), and Immigrants from North Macedonia (96.3%, a difference of 0.030%).
| Demographics | Rating | Rank | 8th Grade |
| Bhutanese | 98.2 /100 | #101 | Exceptional 96.4% |
| South Africans | 98.2 /100 | #102 | Exceptional 96.4% |
| Immigrants | Saudi Arabia | 98.0 /100 | #103 | Exceptional 96.3% |
| Kiowa | 98.0 /100 | #104 | Exceptional 96.3% |
| Immigrants | North Macedonia | 98.0 /100 | #105 | Exceptional 96.3% |
| Okinawans | 98.0 /100 | #106 | Exceptional 96.3% |
| Immigrants | Latvia | 97.8 /100 | #107 | Exceptional 96.3% |
| Lebanese | 97.5 /100 | #108 | Exceptional 96.3% |
| Iroquois | 97.5 /100 | #109 | Exceptional 96.3% |
| Cajuns | 97.1 /100 | #110 | Exceptional 96.3% |
| Shoshone | 96.8 /100 | #111 | Exceptional 96.3% |
| Syrians | 96.7 /100 | #112 | Exceptional 96.3% |
| Immigrants | Zimbabwe | 96.7 /100 | #113 | Exceptional 96.3% |
| Immigrants | Japan | 96.5 /100 | #114 | Exceptional 96.2% |
| Immigrants | Moldova | 96.5 /100 | #115 | Exceptional 96.2% |
Demographics Similar to Immigrants from Netherlands by 8th Grade
In terms of 8th grade, the demographic groups most similar to Immigrants from Netherlands are Zimbabwean (96.5%, a difference of 0.0%), Cypriot (96.5%, a difference of 0.0%), Immigrants from Ireland (96.5%, a difference of 0.010%), Yugoslavian (96.5%, a difference of 0.010%), and New Zealander (96.6%, a difference of 0.020%).
| Demographics | Rating | Rank | 8th Grade |
| Americans | 99.7 /100 | #69 | Exceptional 96.6% |
| Immigrants | Lithuania | 99.6 /100 | #70 | Exceptional 96.6% |
| New Zealanders | 99.5 /100 | #71 | Exceptional 96.6% |
| Immigrants | England | 99.5 /100 | #72 | Exceptional 96.6% |
| Arapaho | 99.5 /100 | #73 | Exceptional 96.6% |
| Immigrants | Ireland | 99.5 /100 | #74 | Exceptional 96.5% |
| Zimbabweans | 99.4 /100 | #75 | Exceptional 96.5% |
| Immigrants | Netherlands | 99.4 /100 | #76 | Exceptional 96.5% |
| Cypriots | 99.4 /100 | #77 | Exceptional 96.5% |
| Yugoslavians | 99.4 /100 | #78 | Exceptional 96.5% |
| Puget Sound Salish | 99.3 /100 | #79 | Exceptional 96.5% |
| Delaware | 99.2 /100 | #80 | Exceptional 96.5% |
| Romanians | 99.2 /100 | #81 | Exceptional 96.5% |
| Turks | 99.2 /100 | #82 | Exceptional 96.5% |
| Icelanders | 99.2 /100 | #83 | Exceptional 96.5% |