Egyptian vs Immigrants from Uruguay Bachelor's Degree
COMPARE
Egyptian
Immigrants from Uruguay
Bachelor's Degree
Bachelor's Degree Comparison
Egyptians
Immigrants from Uruguay
43.3%
BACHELOR'S DEGREE
99.7/ 100
METRIC RATING
67th/ 347
METRIC RANK
37.8%
BACHELOR'S DEGREE
48.3/ 100
METRIC RATING
175th/ 347
METRIC RANK
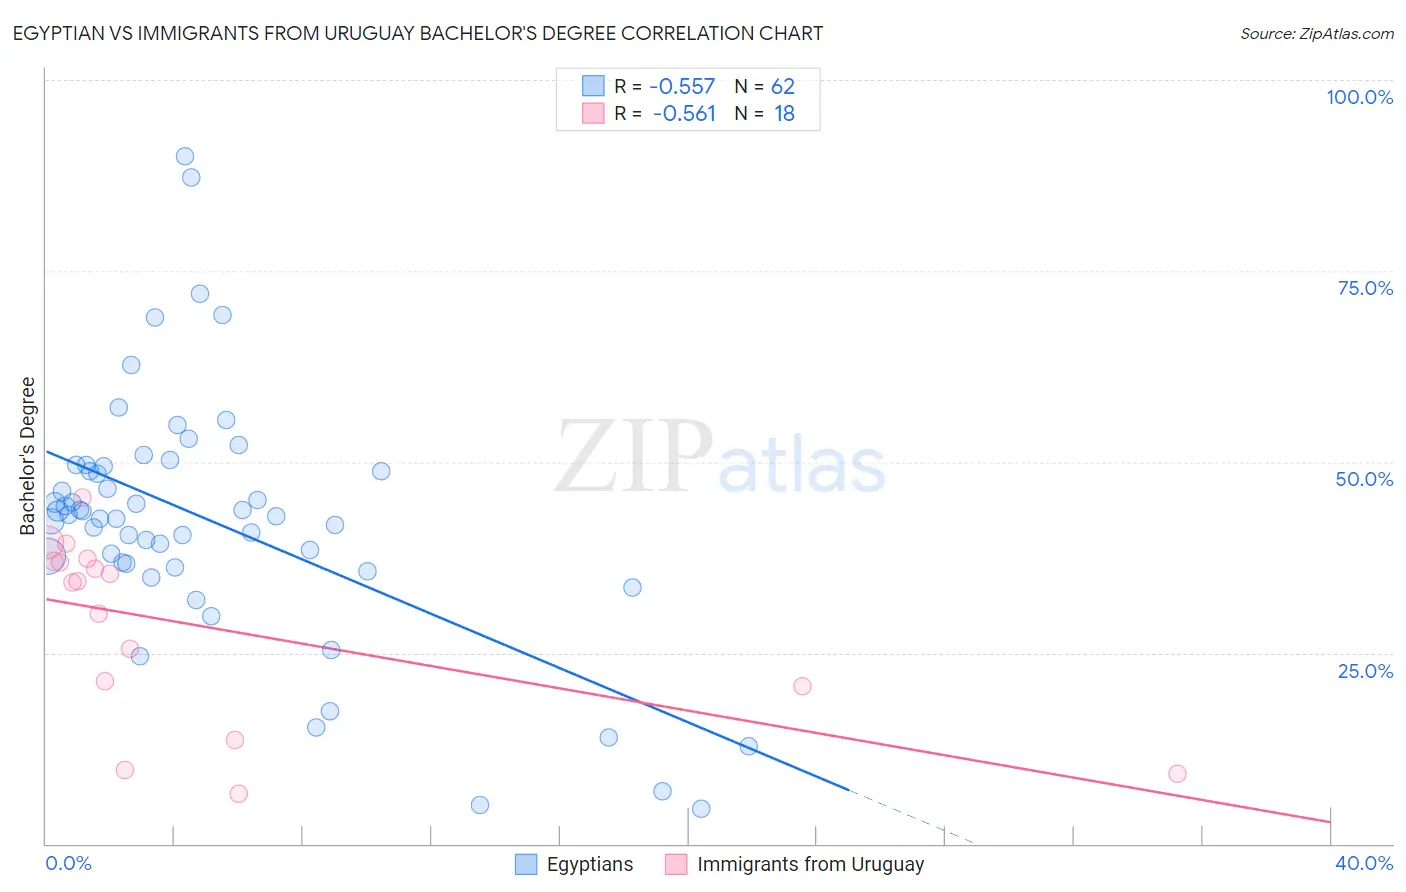
Egyptian vs Immigrants from Uruguay Bachelor's Degree Correlation Chart
The statistical analysis conducted on geographies consisting of 276,908,448 people shows a substantial negative correlation between the proportion of Egyptians and percentage of population with at least bachelor's degree education in the United States with a correlation coefficient (R) of -0.557 and weighted average of 43.3%. Similarly, the statistical analysis conducted on geographies consisting of 133,259,667 people shows a substantial negative correlation between the proportion of Immigrants from Uruguay and percentage of population with at least bachelor's degree education in the United States with a correlation coefficient (R) of -0.561 and weighted average of 37.8%, a difference of 14.6%.
Bachelor's Degree Correlation Summary
| Measurement | Egyptian | Immigrants from Uruguay |
| Minimum | 4.6% | 6.5% |
| Maximum | 90.0% | 45.3% |
| Range | 85.4% | 38.8% |
| Mean | 42.3% | 28.4% |
| Median | 43.0% | 34.4% |
| Interquartile 25% (IQ1) | 36.6% | 20.6% |
| Interquartile 75% (IQ3) | 49.5% | 37.0% |
| Interquartile Range (IQR) | 12.8% | 16.4% |
| Standard Deviation (Sample) | 16.5% | 12.1% |
| Standard Deviation (Population) | 16.3% | 11.7% |
Similar Demographics by Bachelor's Degree
Demographics Similar to Egyptians by Bachelor's Degree
In terms of bachelor's degree, the demographic groups most similar to Egyptians are Immigrants from Netherlands (43.3%, a difference of 0.020%), Immigrants from Indonesia (43.3%, a difference of 0.020%), Zimbabwean (43.3%, a difference of 0.040%), Argentinean (43.3%, a difference of 0.050%), and Immigrants from Pakistan (43.1%, a difference of 0.28%).
| Demographics | Rating | Rank | Bachelor's Degree |
| New Zealanders | 99.9 /100 | #60 | Exceptional 44.0% |
| South Africans | 99.8 /100 | #61 | Exceptional 43.6% |
| Immigrants | Kazakhstan | 99.8 /100 | #62 | Exceptional 43.4% |
| Immigrants | Europe | 99.8 /100 | #63 | Exceptional 43.4% |
| Argentineans | 99.7 /100 | #64 | Exceptional 43.3% |
| Zimbabweans | 99.7 /100 | #65 | Exceptional 43.3% |
| Immigrants | Netherlands | 99.7 /100 | #66 | Exceptional 43.3% |
| Egyptians | 99.7 /100 | #67 | Exceptional 43.3% |
| Immigrants | Indonesia | 99.7 /100 | #68 | Exceptional 43.3% |
| Immigrants | Pakistan | 99.7 /100 | #69 | Exceptional 43.1% |
| Immigrants | Romania | 99.6 /100 | #70 | Exceptional 42.9% |
| Immigrants | Argentina | 99.6 /100 | #71 | Exceptional 42.8% |
| Ethiopians | 99.5 /100 | #72 | Exceptional 42.8% |
| Immigrants | Uzbekistan | 99.5 /100 | #73 | Exceptional 42.8% |
| Bhutanese | 99.5 /100 | #74 | Exceptional 42.7% |
Demographics Similar to Immigrants from Uruguay by Bachelor's Degree
In terms of bachelor's degree, the demographic groups most similar to Immigrants from Uruguay are Costa Rican (37.7%, a difference of 0.080%), Basque (37.7%, a difference of 0.090%), Immigrants from Cameroon (37.7%, a difference of 0.15%), Immigrants from Bangladesh (37.8%, a difference of 0.16%), and Immigrants from Colombia (37.7%, a difference of 0.29%).
| Demographics | Rating | Rank | Bachelor's Degree |
| Danes | 56.2 /100 | #168 | Average 38.1% |
| Ghanaians | 55.3 /100 | #169 | Average 38.0% |
| Czechs | 54.4 /100 | #170 | Average 38.0% |
| Bermudans | 54.2 /100 | #171 | Average 38.0% |
| Immigrants | Somalia | 52.8 /100 | #172 | Average 37.9% |
| Immigrants | Iraq | 52.5 /100 | #173 | Average 37.9% |
| Immigrants | Bangladesh | 50.0 /100 | #174 | Average 37.8% |
| Immigrants | Uruguay | 48.3 /100 | #175 | Average 37.8% |
| Costa Ricans | 47.6 /100 | #176 | Average 37.7% |
| Basques | 47.4 /100 | #177 | Average 37.7% |
| Immigrants | Cameroon | 46.8 /100 | #178 | Average 37.7% |
| Immigrants | Colombia | 45.4 /100 | #179 | Average 37.7% |
| Irish | 44.3 /100 | #180 | Average 37.6% |
| Immigrants | Senegal | 43.8 /100 | #181 | Average 37.6% |
| Immigrants | Bosnia and Herzegovina | 43.4 /100 | #182 | Average 37.6% |