Immigrants from Liberia vs Immigrants from Poland 9th Grade
COMPARE
Immigrants from Liberia
Immigrants from Poland
9th Grade
9th Grade Comparison
Immigrants from Liberia
Immigrants from Poland
94.5%
9TH GRADE
11.8/ 100
METRIC RATING
214th/ 347
METRIC RANK
94.9%
9TH GRADE
46.7/ 100
METRIC RATING
178th/ 347
METRIC RANK
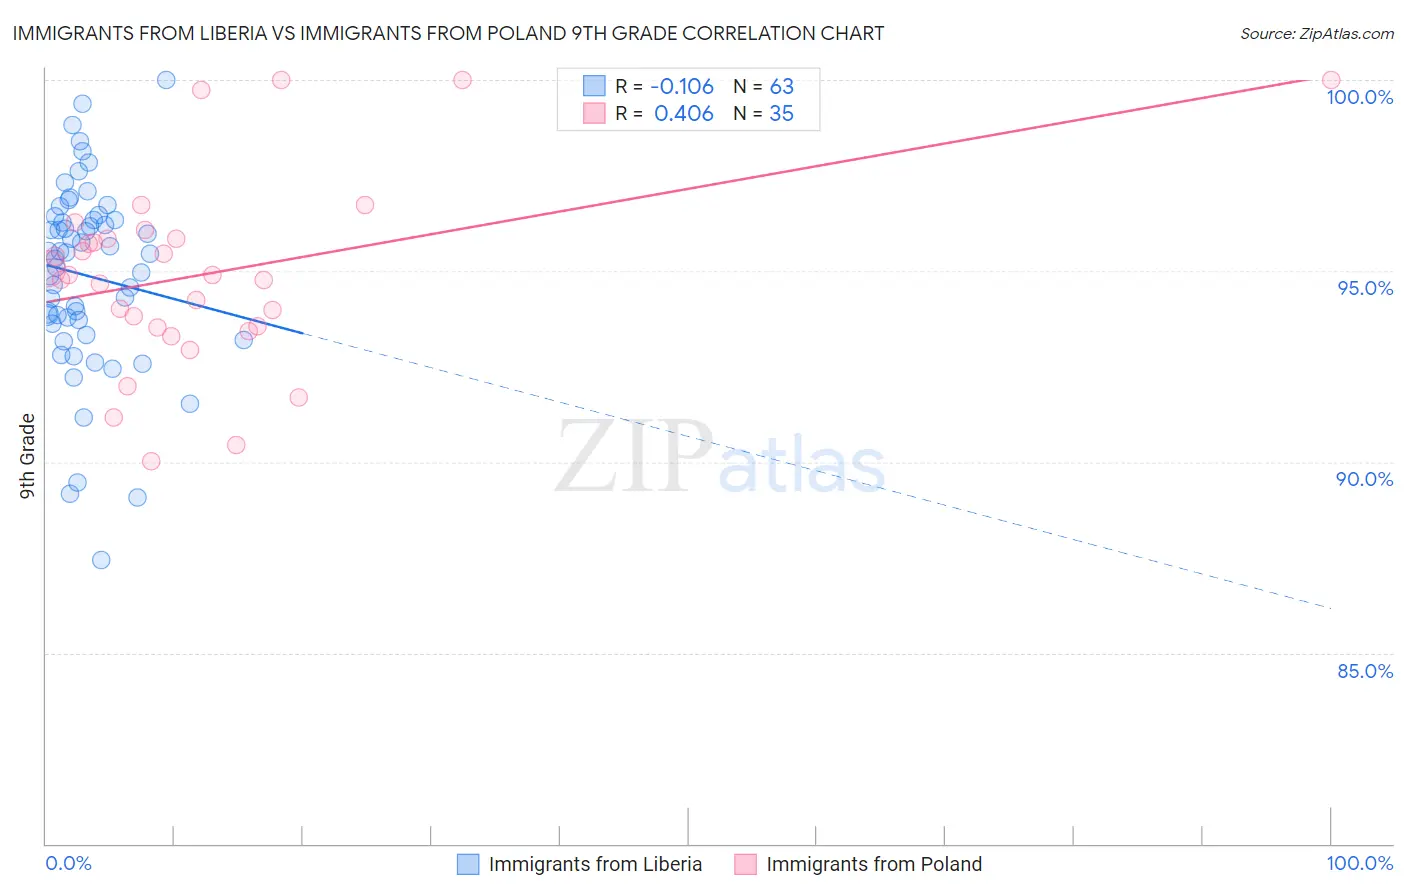
Immigrants from Liberia vs Immigrants from Poland 9th Grade Correlation Chart
The statistical analysis conducted on geographies consisting of 135,292,614 people shows a poor negative correlation between the proportion of Immigrants from Liberia and percentage of population with at least 9th grade education in the United States with a correlation coefficient (R) of -0.106 and weighted average of 94.5%. Similarly, the statistical analysis conducted on geographies consisting of 304,861,877 people shows a moderate positive correlation between the proportion of Immigrants from Poland and percentage of population with at least 9th grade education in the United States with a correlation coefficient (R) of 0.406 and weighted average of 94.9%, a difference of 0.35%.
9th Grade Correlation Summary
| Measurement | Immigrants from Liberia | Immigrants from Poland |
| Minimum | 87.4% | 90.0% |
| Maximum | 100.0% | 100.0% |
| Range | 12.6% | 10.0% |
| Mean | 94.9% | 94.9% |
| Median | 95.5% | 94.9% |
| Interquartile 25% (IQ1) | 93.6% | 93.5% |
| Interquartile 75% (IQ3) | 96.3% | 95.9% |
| Interquartile Range (IQR) | 2.7% | 2.3% |
| Standard Deviation (Sample) | 2.5% | 2.5% |
| Standard Deviation (Population) | 2.5% | 2.4% |
Similar Demographics by 9th Grade
Demographics Similar to Immigrants from Liberia by 9th Grade
In terms of 9th grade, the demographic groups most similar to Immigrants from Liberia are Immigrants from Oceania (94.5%, a difference of 0.0%), Immigrants from Indonesia (94.5%, a difference of 0.010%), Immigrants from Malaysia (94.5%, a difference of 0.010%), Immigrants from Syria (94.5%, a difference of 0.010%), and Immigrants from Western Asia (94.5%, a difference of 0.020%).
| Demographics | Rating | Rank | 9th Grade |
| Immigrants | Morocco | 16.3 /100 | #207 | Poor 94.6% |
| Immigrants | Pakistan | 15.5 /100 | #208 | Poor 94.6% |
| Comanche | 14.9 /100 | #209 | Poor 94.6% |
| Immigrants | Chile | 13.4 /100 | #210 | Poor 94.5% |
| Immigrants | Indonesia | 12.3 /100 | #211 | Poor 94.5% |
| Immigrants | Malaysia | 12.2 /100 | #212 | Poor 94.5% |
| Immigrants | Oceania | 12.1 /100 | #213 | Poor 94.5% |
| Immigrants | Liberia | 11.8 /100 | #214 | Poor 94.5% |
| Immigrants | Syria | 11.0 /100 | #215 | Poor 94.5% |
| Immigrants | Western Asia | 10.7 /100 | #216 | Poor 94.5% |
| Asians | 9.9 /100 | #217 | Tragic 94.5% |
| Portuguese | 9.2 /100 | #218 | Tragic 94.5% |
| Africans | 9.0 /100 | #219 | Tragic 94.5% |
| Indians (Asian) | 8.6 /100 | #220 | Tragic 94.5% |
| Immigrants | Eastern Africa | 8.2 /100 | #221 | Tragic 94.5% |
Demographics Similar to Immigrants from Poland by 9th Grade
In terms of 9th grade, the demographic groups most similar to Immigrants from Poland are Immigrants from Venezuela (94.9%, a difference of 0.0%), Immigrants from Iraq (94.9%, a difference of 0.010%), Immigrants from Egypt (94.9%, a difference of 0.020%), Brazilian (94.9%, a difference of 0.020%), and Immigrants from Spain (94.9%, a difference of 0.020%).
| Demographics | Rating | Rank | 9th Grade |
| Colville | 58.5 /100 | #171 | Average 94.9% |
| Iraqis | 54.0 /100 | #172 | Average 94.9% |
| Cheyenne | 51.5 /100 | #173 | Average 94.9% |
| Immigrants | Egypt | 50.0 /100 | #174 | Average 94.9% |
| Brazilians | 49.8 /100 | #175 | Average 94.9% |
| Immigrants | Spain | 49.1 /100 | #176 | Average 94.9% |
| Immigrants | Iraq | 47.8 /100 | #177 | Average 94.9% |
| Immigrants | Poland | 46.7 /100 | #178 | Average 94.9% |
| Immigrants | Venezuela | 46.5 /100 | #179 | Average 94.9% |
| Immigrants | Uganda | 43.1 /100 | #180 | Average 94.8% |
| Sierra Leoneans | 42.7 /100 | #181 | Average 94.8% |
| Seminole | 42.5 /100 | #182 | Average 94.8% |
| Immigrants | Nepal | 39.7 /100 | #183 | Fair 94.8% |
| Argentineans | 37.6 /100 | #184 | Fair 94.8% |
| Liberians | 37.4 /100 | #185 | Fair 94.8% |