Australian vs Estonian Bachelor's Degree
COMPARE
Australian
Estonian
Bachelor's Degree
Bachelor's Degree Comparison
Australians
Estonians
44.0%
BACHELOR'S DEGREE
99.9/ 100
METRIC RATING
59th/ 347
METRIC RANK
44.6%
BACHELOR'S DEGREE
99.9/ 100
METRIC RATING
48th/ 347
METRIC RANK
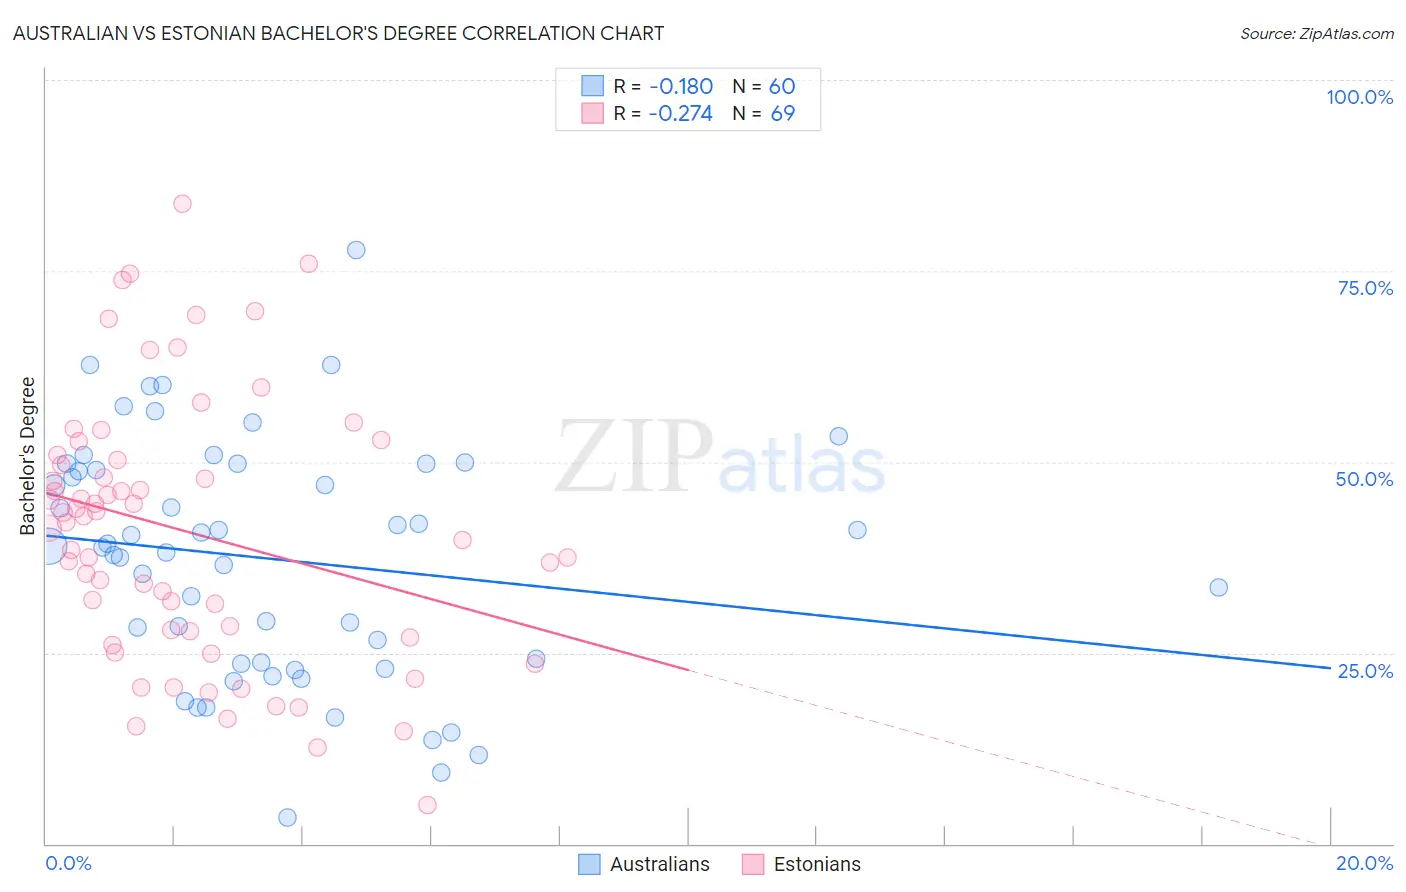
Australian vs Estonian Bachelor's Degree Correlation Chart
The statistical analysis conducted on geographies consisting of 224,140,970 people shows a poor negative correlation between the proportion of Australians and percentage of population with at least bachelor's degree education in the United States with a correlation coefficient (R) of -0.180 and weighted average of 44.0%. Similarly, the statistical analysis conducted on geographies consisting of 123,528,478 people shows a weak negative correlation between the proportion of Estonians and percentage of population with at least bachelor's degree education in the United States with a correlation coefficient (R) of -0.274 and weighted average of 44.6%, a difference of 1.3%.
Bachelor's Degree Correlation Summary
| Measurement | Australian | Estonian |
| Minimum | 3.4% | 5.1% |
| Maximum | 77.7% | 83.7% |
| Range | 74.3% | 78.7% |
| Mean | 37.3% | 40.9% |
| Median | 38.9% | 42.0% |
| Interquartile 25% (IQ1) | 23.7% | 27.5% |
| Interquartile 75% (IQ3) | 49.3% | 50.5% |
| Interquartile Range (IQR) | 25.7% | 23.1% |
| Standard Deviation (Sample) | 15.6% | 17.3% |
| Standard Deviation (Population) | 15.5% | 17.1% |
Demographics Similar to Australians and Estonians by Bachelor's Degree
In terms of bachelor's degree, the demographic groups most similar to Australians are New Zealander (44.0%, a difference of 0.010%), Immigrants from Czechoslovakia (44.0%, a difference of 0.10%), Paraguayan (44.0%, a difference of 0.16%), Immigrants from Serbia (44.1%, a difference of 0.34%), and Immigrants from Austria (44.2%, a difference of 0.53%). Similarly, the demographic groups most similar to Estonians are Bolivian (44.6%, a difference of 0.0%), Immigrants from Bulgaria (44.6%, a difference of 0.040%), Immigrants from Kuwait (44.6%, a difference of 0.10%), Immigrants from Lithuania (44.6%, a difference of 0.12%), and Immigrants from Norway (44.5%, a difference of 0.12%).
| Demographics | Rating | Rank | Bachelor's Degree |
| Immigrants | South Africa | 99.9 /100 | #43 | Exceptional 44.8% |
| Immigrants | Lithuania | 99.9 /100 | #44 | Exceptional 44.6% |
| Immigrants | Kuwait | 99.9 /100 | #45 | Exceptional 44.6% |
| Immigrants | Bulgaria | 99.9 /100 | #46 | Exceptional 44.6% |
| Bolivians | 99.9 /100 | #47 | Exceptional 44.6% |
| Estonians | 99.9 /100 | #48 | Exceptional 44.6% |
| Immigrants | Norway | 99.9 /100 | #49 | Exceptional 44.5% |
| Immigrants | Greece | 99.9 /100 | #50 | Exceptional 44.5% |
| Asians | 99.9 /100 | #51 | Exceptional 44.4% |
| Immigrants | Spain | 99.9 /100 | #52 | Exceptional 44.3% |
| Immigrants | Asia | 99.9 /100 | #53 | Exceptional 44.3% |
| Immigrants | Austria | 99.9 /100 | #54 | Exceptional 44.2% |
| Immigrants | Bolivia | 99.9 /100 | #55 | Exceptional 44.2% |
| Immigrants | Serbia | 99.9 /100 | #56 | Exceptional 44.1% |
| Paraguayans | 99.9 /100 | #57 | Exceptional 44.0% |
| Immigrants | Czechoslovakia | 99.9 /100 | #58 | Exceptional 44.0% |
| Australians | 99.9 /100 | #59 | Exceptional 44.0% |
| New Zealanders | 99.9 /100 | #60 | Exceptional 44.0% |
| South Africans | 99.8 /100 | #61 | Exceptional 43.6% |
| Immigrants | Kazakhstan | 99.8 /100 | #62 | Exceptional 43.4% |
| Immigrants | Europe | 99.8 /100 | #63 | Exceptional 43.4% |