Romanian vs Estonian 12th Grade, No Diploma
COMPARE
Romanian
Estonian
12th Grade, No Diploma
12th Grade, No Diploma Comparison
Romanians
Estonians
92.6%
12TH GRADE, NO DIPLOMA
99.3/ 100
METRIC RATING
79th/ 347
METRIC RANK
93.2%
12TH GRADE, NO DIPLOMA
99.9/ 100
METRIC RATING
22nd/ 347
METRIC RANK
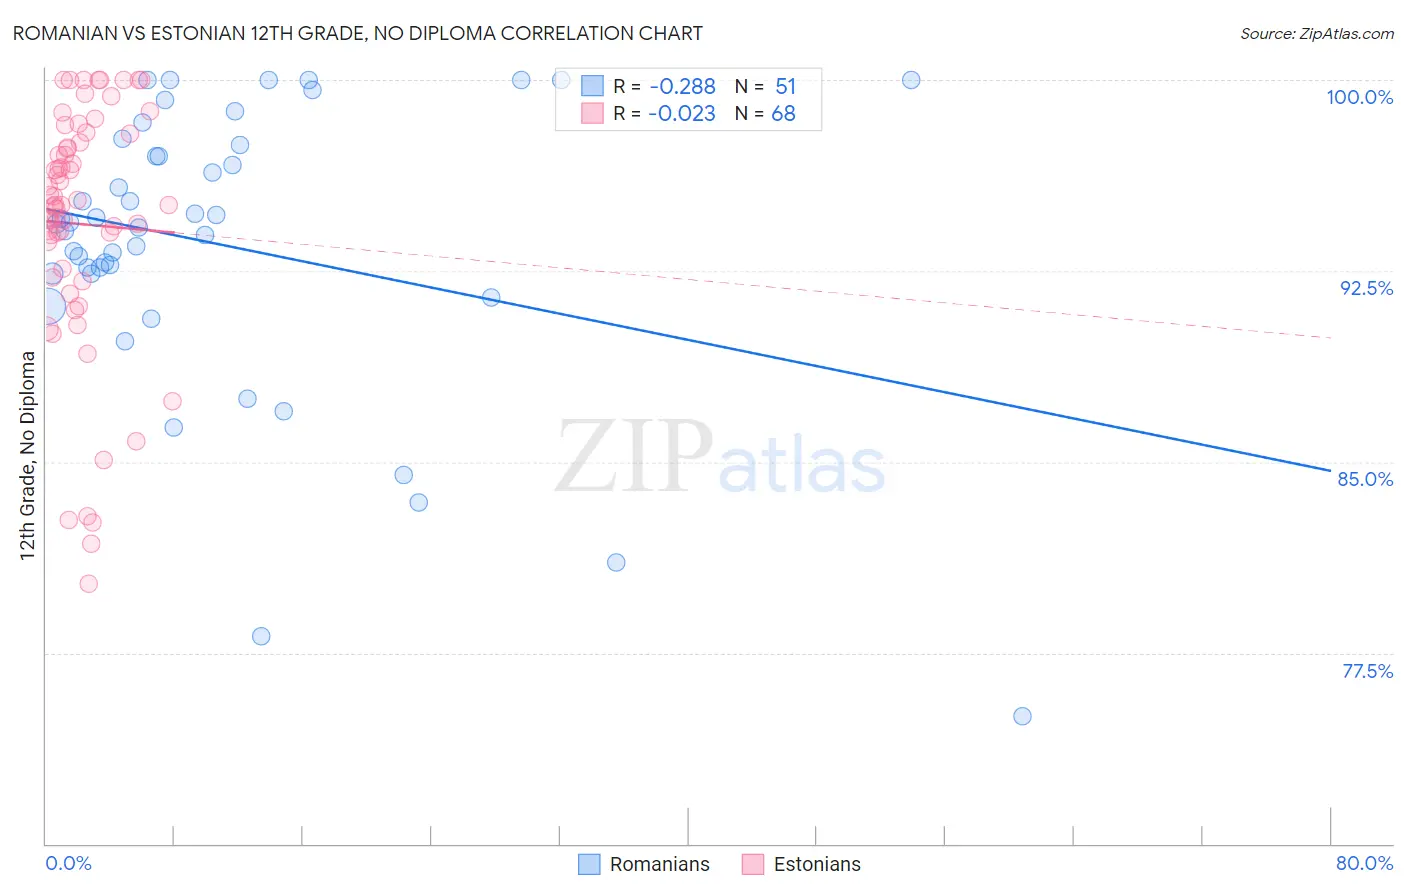
Romanian vs Estonian 12th Grade, No Diploma Correlation Chart
The statistical analysis conducted on geographies consisting of 377,905,400 people shows a weak negative correlation between the proportion of Romanians and percentage of population with at least 12th grade (no diploma) education in the United States with a correlation coefficient (R) of -0.288 and weighted average of 92.6%. Similarly, the statistical analysis conducted on geographies consisting of 123,528,404 people shows no correlation between the proportion of Estonians and percentage of population with at least 12th grade (no diploma) education in the United States with a correlation coefficient (R) of -0.023 and weighted average of 93.2%, a difference of 0.69%.
12th Grade, No Diploma Correlation Summary
| Measurement | Romanian | Estonian |
| Minimum | 75.0% | 80.2% |
| Maximum | 100.0% | 100.0% |
| Range | 25.0% | 19.8% |
| Mean | 93.5% | 94.3% |
| Median | 94.4% | 95.1% |
| Interquartile 25% (IQ1) | 92.4% | 92.4% |
| Interquartile 75% (IQ3) | 97.5% | 97.7% |
| Interquartile Range (IQR) | 5.1% | 5.3% |
| Standard Deviation (Sample) | 5.6% | 4.9% |
| Standard Deviation (Population) | 5.6% | 4.8% |
Similar Demographics by 12th Grade, No Diploma
Demographics Similar to Romanians by 12th Grade, No Diploma
In terms of 12th grade, no diploma, the demographic groups most similar to Romanians are Cambodian (92.6%, a difference of 0.0%), French Canadian (92.6%, a difference of 0.010%), Immigrants from England (92.6%, a difference of 0.030%), Immigrants from Denmark (92.5%, a difference of 0.030%), and Immigrants from Switzerland (92.5%, a difference of 0.040%).
| Demographics | Rating | Rank | 12th Grade, No Diploma |
| Immigrants | South Central Asia | 99.5 /100 | #72 | Exceptional 92.6% |
| Burmese | 99.4 /100 | #73 | Exceptional 92.6% |
| Immigrants | Moldova | 99.4 /100 | #74 | Exceptional 92.6% |
| Native Hawaiians | 99.4 /100 | #75 | Exceptional 92.6% |
| French | 99.4 /100 | #76 | Exceptional 92.6% |
| Immigrants | England | 99.4 /100 | #77 | Exceptional 92.6% |
| Cambodians | 99.3 /100 | #78 | Exceptional 92.6% |
| Romanians | 99.3 /100 | #79 | Exceptional 92.6% |
| French Canadians | 99.3 /100 | #80 | Exceptional 92.6% |
| Immigrants | Denmark | 99.2 /100 | #81 | Exceptional 92.5% |
| Immigrants | Switzerland | 99.2 /100 | #82 | Exceptional 92.5% |
| Immigrants | Israel | 99.2 /100 | #83 | Exceptional 92.5% |
| Immigrants | Bulgaria | 99.1 /100 | #84 | Exceptional 92.5% |
| Immigrants | Saudi Arabia | 99.0 /100 | #85 | Exceptional 92.5% |
| Immigrants | Turkey | 98.9 /100 | #86 | Exceptional 92.4% |
Demographics Similar to Estonians by 12th Grade, No Diploma
In terms of 12th grade, no diploma, the demographic groups most similar to Estonians are Italian (93.2%, a difference of 0.010%), Scandinavian (93.2%, a difference of 0.010%), Thai (93.2%, a difference of 0.020%), Filipino (93.2%, a difference of 0.030%), and Czech (93.2%, a difference of 0.040%).
| Demographics | Rating | Rank | 12th Grade, No Diploma |
| Finns | 100.0 /100 | #15 | Exceptional 93.4% |
| Maltese | 100.0 /100 | #16 | Exceptional 93.3% |
| Luxembourgers | 100.0 /100 | #17 | Exceptional 93.3% |
| Immigrants | Singapore | 99.9 /100 | #18 | Exceptional 93.3% |
| Germans | 99.9 /100 | #19 | Exceptional 93.3% |
| Filipinos | 99.9 /100 | #20 | Exceptional 93.2% |
| Italians | 99.9 /100 | #21 | Exceptional 93.2% |
| Estonians | 99.9 /100 | #22 | Exceptional 93.2% |
| Scandinavians | 99.9 /100 | #23 | Exceptional 93.2% |
| Thais | 99.9 /100 | #24 | Exceptional 93.2% |
| Czechs | 99.9 /100 | #25 | Exceptional 93.2% |
| Russians | 99.9 /100 | #26 | Exceptional 93.2% |
| Cypriots | 99.9 /100 | #27 | Exceptional 93.1% |
| Immigrants | Northern Europe | 99.9 /100 | #28 | Exceptional 93.1% |
| Iranians | 99.9 /100 | #29 | Exceptional 93.1% |