Immigrants from Brazil vs Danish Nursery School
COMPARE
Immigrants from Brazil
Danish
Nursery School
Nursery School Comparison
Immigrants from Brazil
Danes
98.0%
NURSERY SCHOOL
51.3/ 100
METRIC RATING
172nd/ 347
METRIC RANK
98.6%
NURSERY SCHOOL
100.0/ 100
METRIC RATING
24th/ 347
METRIC RANK
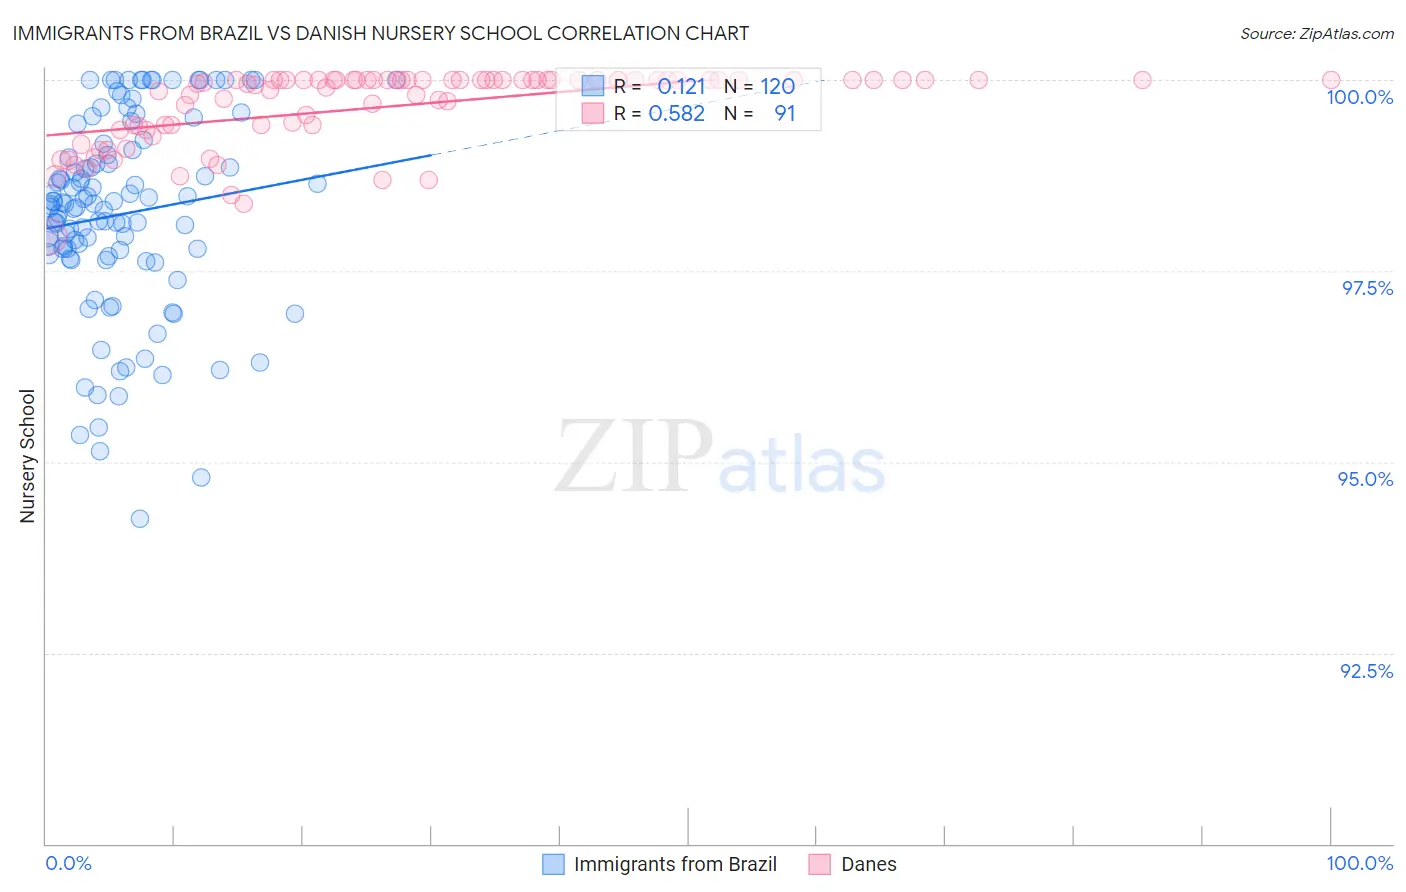
Immigrants from Brazil vs Danish Nursery School Correlation Chart
The statistical analysis conducted on geographies consisting of 343,021,580 people shows a poor positive correlation between the proportion of Immigrants from Brazil and percentage of population with at least nursery school education in the United States with a correlation coefficient (R) of 0.121 and weighted average of 98.0%. Similarly, the statistical analysis conducted on geographies consisting of 474,193,610 people shows a substantial positive correlation between the proportion of Danes and percentage of population with at least nursery school education in the United States with a correlation coefficient (R) of 0.582 and weighted average of 98.6%, a difference of 0.65%.
Nursery School Correlation Summary
| Measurement | Immigrants from Brazil | Danish |
| Minimum | 94.3% | 98.0% |
| Maximum | 100.0% | 100.0% |
| Range | 5.7% | 2.0% |
| Mean | 98.2% | 99.7% |
| Median | 98.4% | 100.0% |
| Interquartile 25% (IQ1) | 97.7% | 99.4% |
| Interquartile 75% (IQ3) | 99.1% | 100.0% |
| Interquartile Range (IQR) | 1.3% | 0.60% |
| Standard Deviation (Sample) | 1.3% | 0.49% |
| Standard Deviation (Population) | 1.3% | 0.49% |
Similar Demographics by Nursery School
Demographics Similar to Immigrants from Brazil by Nursery School
In terms of nursery school, the demographic groups most similar to Immigrants from Brazil are Kenyan (98.0%, a difference of 0.0%), Navajo (98.0%, a difference of 0.0%), Immigrants from Sri Lanka (98.0%, a difference of 0.0%), Immigrants from Venezuela (98.0%, a difference of 0.0%), and Spanish American (98.0%, a difference of 0.010%).
| Demographics | Rating | Rank | Nursery School |
| Chileans | 56.4 /100 | #165 | Average 98.0% |
| Spanish Americans | 55.6 /100 | #166 | Average 98.0% |
| Immigrants | Spain | 55.6 /100 | #167 | Average 98.0% |
| Immigrants | Micronesia | 55.0 /100 | #168 | Average 98.0% |
| Immigrants | Korea | 53.8 /100 | #169 | Average 98.0% |
| Bermudans | 53.7 /100 | #170 | Average 98.0% |
| Immigrants | Jordan | 53.4 /100 | #171 | Average 98.0% |
| Immigrants | Brazil | 51.3 /100 | #172 | Average 98.0% |
| Kenyans | 50.2 /100 | #173 | Average 98.0% |
| Navajo | 50.0 /100 | #174 | Average 98.0% |
| Immigrants | Sri Lanka | 49.9 /100 | #175 | Average 98.0% |
| Immigrants | Venezuela | 49.8 /100 | #176 | Average 98.0% |
| Albanians | 48.9 /100 | #177 | Average 98.0% |
| Natives/Alaskans | 48.6 /100 | #178 | Average 98.0% |
| Argentineans | 46.8 /100 | #179 | Average 98.0% |
Demographics Similar to Danes by Nursery School
In terms of nursery school, the demographic groups most similar to Danes are Pennsylvania German (98.6%, a difference of 0.0%), Finnish (98.6%, a difference of 0.0%), Lithuanian (98.6%, a difference of 0.0%), Polish (98.6%, a difference of 0.0%), and Scotch-Irish (98.6%, a difference of 0.0%).
| Demographics | Rating | Rank | Nursery School |
| Aleuts | 100.0 /100 | #17 | Exceptional 98.7% |
| Dutch | 100.0 /100 | #18 | Exceptional 98.7% |
| Irish | 100.0 /100 | #19 | Exceptional 98.6% |
| Pennsylvania Germans | 100.0 /100 | #20 | Exceptional 98.6% |
| Finns | 100.0 /100 | #21 | Exceptional 98.6% |
| Lithuanians | 100.0 /100 | #22 | Exceptional 98.6% |
| Poles | 100.0 /100 | #23 | Exceptional 98.6% |
| Danes | 100.0 /100 | #24 | Exceptional 98.6% |
| Scotch-Irish | 100.0 /100 | #25 | Exceptional 98.6% |
| Sioux | 100.0 /100 | #26 | Exceptional 98.6% |
| Arapaho | 100.0 /100 | #27 | Exceptional 98.6% |
| Croatians | 100.0 /100 | #28 | Exceptional 98.6% |
| French | 100.0 /100 | #29 | Exceptional 98.6% |
| Europeans | 100.0 /100 | #30 | Exceptional 98.6% |
| Czechs | 100.0 /100 | #31 | Exceptional 98.6% |