Immigrants from Haiti vs Danish Nursery School
COMPARE
Immigrants from Haiti
Danish
Nursery School
Nursery School Comparison
Immigrants from Haiti
Danes
97.0%
NURSERY SCHOOL
0.0/ 100
METRIC RATING
308th/ 347
METRIC RANK
98.6%
NURSERY SCHOOL
100.0/ 100
METRIC RATING
24th/ 347
METRIC RANK
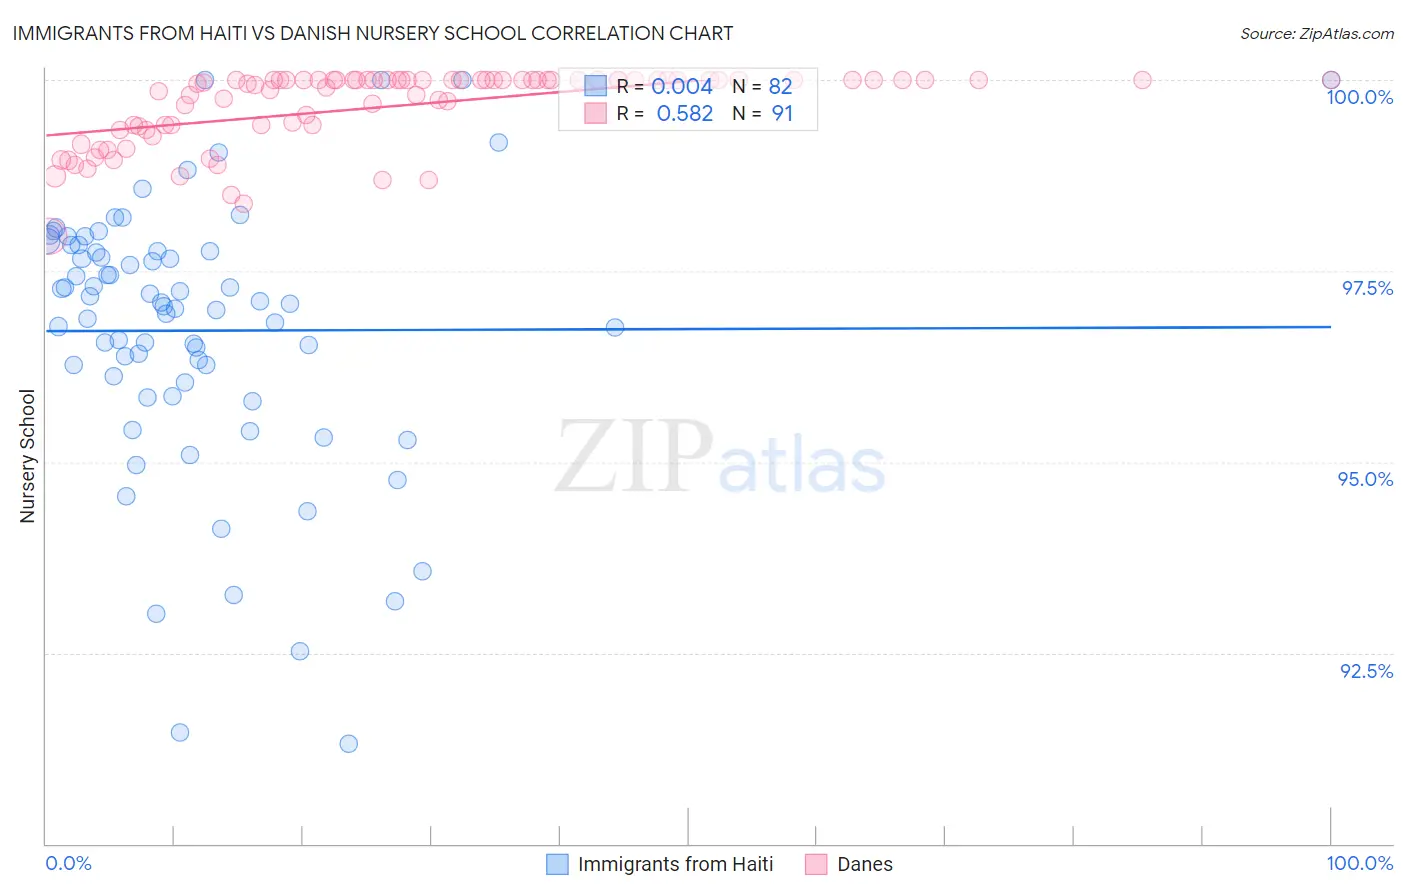
Immigrants from Haiti vs Danish Nursery School Correlation Chart
The statistical analysis conducted on geographies consisting of 225,286,614 people shows no correlation between the proportion of Immigrants from Haiti and percentage of population with at least nursery school education in the United States with a correlation coefficient (R) of 0.004 and weighted average of 97.0%. Similarly, the statistical analysis conducted on geographies consisting of 474,193,610 people shows a substantial positive correlation between the proportion of Danes and percentage of population with at least nursery school education in the United States with a correlation coefficient (R) of 0.582 and weighted average of 98.6%, a difference of 1.7%.
Nursery School Correlation Summary
| Measurement | Immigrants from Haiti | Danish |
| Minimum | 91.3% | 98.0% |
| Maximum | 100.0% | 100.0% |
| Range | 8.7% | 2.0% |
| Mean | 96.7% | 99.7% |
| Median | 97.1% | 100.0% |
| Interquartile 25% (IQ1) | 96.0% | 99.4% |
| Interquartile 75% (IQ3) | 97.8% | 100.0% |
| Interquartile Range (IQR) | 1.7% | 0.60% |
| Standard Deviation (Sample) | 1.8% | 0.49% |
| Standard Deviation (Population) | 1.8% | 0.49% |
Similar Demographics by Nursery School
Demographics Similar to Immigrants from Haiti by Nursery School
In terms of nursery school, the demographic groups most similar to Immigrants from Haiti are Hispanic or Latino (97.0%, a difference of 0.0%), Belizean (97.0%, a difference of 0.010%), Immigrants from Somalia (97.0%, a difference of 0.010%), Guyanese (97.0%, a difference of 0.030%), and Immigrants from the Azores (97.0%, a difference of 0.030%).
| Demographics | Rating | Rank | Nursery School |
| Immigrants | South Eastern Asia | 0.0 /100 | #301 | Tragic 97.1% |
| Immigrants | Caribbean | 0.0 /100 | #302 | Tragic 97.1% |
| Nicaraguans | 0.0 /100 | #303 | Tragic 97.1% |
| Ecuadorians | 0.0 /100 | #304 | Tragic 97.1% |
| Somalis | 0.0 /100 | #305 | Tragic 97.1% |
| Belizeans | 0.0 /100 | #306 | Tragic 97.0% |
| Hispanics or Latinos | 0.0 /100 | #307 | Tragic 97.0% |
| Immigrants | Haiti | 0.0 /100 | #308 | Tragic 97.0% |
| Immigrants | Somalia | 0.0 /100 | #309 | Tragic 97.0% |
| Guyanese | 0.0 /100 | #310 | Tragic 97.0% |
| Immigrants | Azores | 0.0 /100 | #311 | Tragic 97.0% |
| Sri Lankans | 0.0 /100 | #312 | Tragic 97.0% |
| Hondurans | 0.0 /100 | #313 | Tragic 97.0% |
| Cape Verdeans | 0.0 /100 | #314 | Tragic 97.0% |
| Immigrants | Nicaragua | 0.0 /100 | #315 | Tragic 96.9% |
Demographics Similar to Danes by Nursery School
In terms of nursery school, the demographic groups most similar to Danes are Pennsylvania German (98.6%, a difference of 0.0%), Finnish (98.6%, a difference of 0.0%), Lithuanian (98.6%, a difference of 0.0%), Polish (98.6%, a difference of 0.0%), and Scotch-Irish (98.6%, a difference of 0.0%).
| Demographics | Rating | Rank | Nursery School |
| Aleuts | 100.0 /100 | #17 | Exceptional 98.7% |
| Dutch | 100.0 /100 | #18 | Exceptional 98.7% |
| Irish | 100.0 /100 | #19 | Exceptional 98.6% |
| Pennsylvania Germans | 100.0 /100 | #20 | Exceptional 98.6% |
| Finns | 100.0 /100 | #21 | Exceptional 98.6% |
| Lithuanians | 100.0 /100 | #22 | Exceptional 98.6% |
| Poles | 100.0 /100 | #23 | Exceptional 98.6% |
| Danes | 100.0 /100 | #24 | Exceptional 98.6% |
| Scotch-Irish | 100.0 /100 | #25 | Exceptional 98.6% |
| Sioux | 100.0 /100 | #26 | Exceptional 98.6% |
| Arapaho | 100.0 /100 | #27 | Exceptional 98.6% |
| Croatians | 100.0 /100 | #28 | Exceptional 98.6% |
| French | 100.0 /100 | #29 | Exceptional 98.6% |
| Europeans | 100.0 /100 | #30 | Exceptional 98.6% |
| Czechs | 100.0 /100 | #31 | Exceptional 98.6% |