Romanian vs Samoan College, Under 1 year
COMPARE
Romanian
Samoan
College, Under 1 year
College, Under 1 year Comparison
Romanians
Samoans
68.2%
COLLEGE, UNDER 1 YEAR
97.9/ 100
METRIC RATING
93rd/ 347
METRIC RANK
63.0%
COLLEGE, UNDER 1 YEAR
3.3/ 100
METRIC RATING
228th/ 347
METRIC RANK
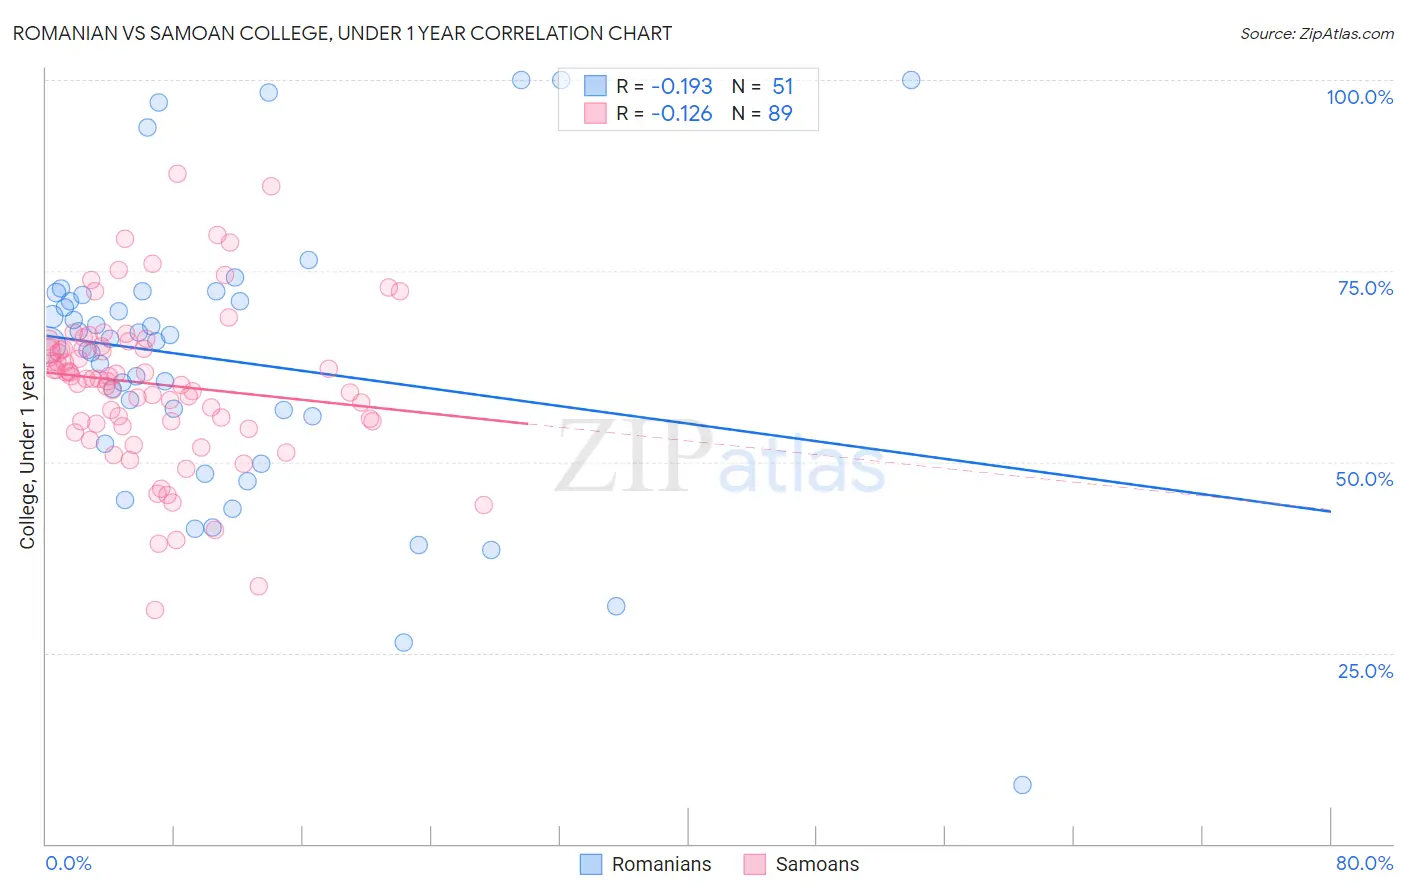
Romanian vs Samoan College, Under 1 year Correlation Chart
The statistical analysis conducted on geographies consisting of 377,903,335 people shows a poor negative correlation between the proportion of Romanians and percentage of population with at least college, under 1 year education in the United States with a correlation coefficient (R) of -0.193 and weighted average of 68.2%. Similarly, the statistical analysis conducted on geographies consisting of 225,205,919 people shows a poor negative correlation between the proportion of Samoans and percentage of population with at least college, under 1 year education in the United States with a correlation coefficient (R) of -0.126 and weighted average of 63.0%, a difference of 8.2%.
College, Under 1 year Correlation Summary
| Measurement | Romanian | Samoan |
| Minimum | 7.6% | 30.5% |
| Maximum | 100.0% | 87.7% |
| Range | 92.4% | 57.2% |
| Mean | 63.3% | 60.2% |
| Median | 65.8% | 61.0% |
| Interquartile 25% (IQ1) | 52.4% | 55.1% |
| Interquartile 75% (IQ3) | 71.8% | 65.1% |
| Interquartile Range (IQR) | 19.5% | 10.0% |
| Standard Deviation (Sample) | 18.8% | 10.3% |
| Standard Deviation (Population) | 18.7% | 10.3% |
Similar Demographics by College, Under 1 year
Demographics Similar to Romanians by College, Under 1 year
In terms of college, under 1 year, the demographic groups most similar to Romanians are Luxembourger (68.2%, a difference of 0.090%), Armenian (68.1%, a difference of 0.090%), European (68.2%, a difference of 0.10%), Icelander (68.3%, a difference of 0.13%), and Ethiopian (68.3%, a difference of 0.19%).
| Demographics | Rating | Rank | College, Under 1 year |
| Immigrants | Lebanon | 98.3 /100 | #86 | Exceptional 68.3% |
| Chinese | 98.3 /100 | #87 | Exceptional 68.3% |
| Croatians | 98.2 /100 | #88 | Exceptional 68.3% |
| Ethiopians | 98.2 /100 | #89 | Exceptional 68.3% |
| Icelanders | 98.1 /100 | #90 | Exceptional 68.3% |
| Europeans | 98.1 /100 | #91 | Exceptional 68.2% |
| Luxembourgers | 98.1 /100 | #92 | Exceptional 68.2% |
| Romanians | 97.9 /100 | #93 | Exceptional 68.2% |
| Armenians | 97.7 /100 | #94 | Exceptional 68.1% |
| Immigrants | Pakistan | 97.5 /100 | #95 | Exceptional 68.0% |
| Jordanians | 97.4 /100 | #96 | Exceptional 68.0% |
| Immigrants | Ethiopia | 97.3 /100 | #97 | Exceptional 68.0% |
| Paraguayans | 97.1 /100 | #98 | Exceptional 67.9% |
| Immigrants | Bolivia | 97.0 /100 | #99 | Exceptional 67.9% |
| Immigrants | Argentina | 97.0 /100 | #100 | Exceptional 67.9% |
Demographics Similar to Samoans by College, Under 1 year
In terms of college, under 1 year, the demographic groups most similar to Samoans are Liberian (63.0%, a difference of 0.050%), Immigrants from Ghana (63.1%, a difference of 0.11%), Nonimmigrants (62.9%, a difference of 0.13%), Immigrants from Colombia (63.1%, a difference of 0.20%), and Immigrants from Peru (63.1%, a difference of 0.22%).
| Demographics | Rating | Rank | College, Under 1 year |
| Cree | 5.2 /100 | #221 | Tragic 63.3% |
| Immigrants | Senegal | 5.0 /100 | #222 | Tragic 63.3% |
| Immigrants | Costa Rica | 4.5 /100 | #223 | Tragic 63.2% |
| Sub-Saharan Africans | 4.4 /100 | #224 | Tragic 63.2% |
| Immigrants | Peru | 4.0 /100 | #225 | Tragic 63.1% |
| Immigrants | Colombia | 4.0 /100 | #226 | Tragic 63.1% |
| Immigrants | Ghana | 3.7 /100 | #227 | Tragic 63.1% |
| Samoans | 3.3 /100 | #228 | Tragic 63.0% |
| Liberians | 3.2 /100 | #229 | Tragic 63.0% |
| Immigrants | Nonimmigrants | 3.0 /100 | #230 | Tragic 62.9% |
| Immigrants | Western Africa | 2.4 /100 | #231 | Tragic 62.8% |
| Osage | 2.2 /100 | #232 | Tragic 62.7% |
| Iroquois | 2.0 /100 | #233 | Tragic 62.6% |
| Chippewa | 2.0 /100 | #234 | Tragic 62.6% |
| Spanish Americans | 1.9 /100 | #235 | Tragic 62.6% |