Puerto Rican vs Guatemalan 2nd Grade
COMPARE
Puerto Rican
Guatemalan
2nd Grade
2nd Grade Comparison
Puerto Ricans
Guatemalans
97.5%
2ND GRADE
0.7/ 100
METRIC RATING
253rd/ 347
METRIC RANK
96.3%
2ND GRADE
0.0/ 100
METRIC RATING
339th/ 347
METRIC RANK
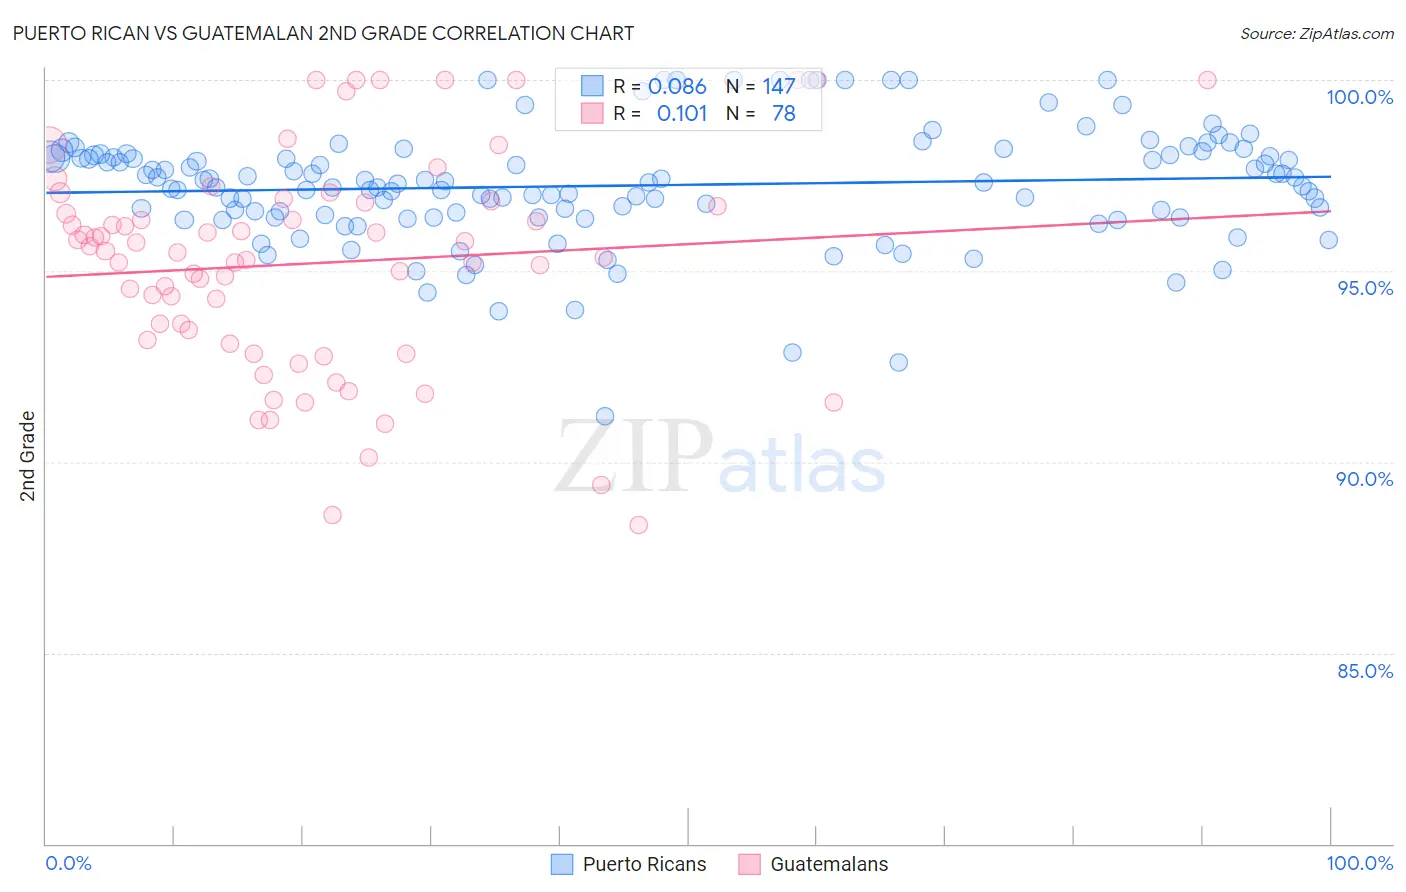
Puerto Rican vs Guatemalan 2nd Grade Correlation Chart
The statistical analysis conducted on geographies consisting of 528,320,522 people shows a slight positive correlation between the proportion of Puerto Ricans and percentage of population with at least 2nd grade education in the United States with a correlation coefficient (R) of 0.086 and weighted average of 97.5%. Similarly, the statistical analysis conducted on geographies consisting of 409,566,469 people shows a poor positive correlation between the proportion of Guatemalans and percentage of population with at least 2nd grade education in the United States with a correlation coefficient (R) of 0.101 and weighted average of 96.3%, a difference of 1.2%.
2nd Grade Correlation Summary
| Measurement | Puerto Rican | Guatemalan |
| Minimum | 91.2% | 88.3% |
| Maximum | 100.0% | 100.0% |
| Range | 8.8% | 11.7% |
| Mean | 97.2% | 95.2% |
| Median | 97.3% | 95.5% |
| Interquartile 25% (IQ1) | 96.4% | 93.2% |
| Interquartile 75% (IQ3) | 98.1% | 96.8% |
| Interquartile Range (IQR) | 1.6% | 3.6% |
| Standard Deviation (Sample) | 1.5% | 2.8% |
| Standard Deviation (Population) | 1.5% | 2.8% |
Similar Demographics by 2nd Grade
Demographics Similar to Puerto Ricans by 2nd Grade
In terms of 2nd grade, the demographic groups most similar to Puerto Ricans are Immigrants from Asia (97.5%, a difference of 0.0%), Immigrants from Africa (97.5%, a difference of 0.010%), Indian (Asian) (97.5%, a difference of 0.010%), Immigrants from Congo (97.5%, a difference of 0.010%), and South American (97.5%, a difference of 0.020%).
| Demographics | Rating | Rank | 2nd Grade |
| South Americans | 0.9 /100 | #246 | Tragic 97.5% |
| Immigrants | Senegal | 0.9 /100 | #247 | Tragic 97.5% |
| Immigrants | Middle Africa | 0.9 /100 | #248 | Tragic 97.5% |
| Bolivians | 0.9 /100 | #249 | Tragic 97.5% |
| Peruvians | 0.9 /100 | #250 | Tragic 97.5% |
| Immigrants | Africa | 0.8 /100 | #251 | Tragic 97.5% |
| Immigrants | Asia | 0.7 /100 | #252 | Tragic 97.5% |
| Puerto Ricans | 0.7 /100 | #253 | Tragic 97.5% |
| Indians (Asian) | 0.6 /100 | #254 | Tragic 97.5% |
| Immigrants | Congo | 0.6 /100 | #255 | Tragic 97.5% |
| Jamaicans | 0.6 /100 | #256 | Tragic 97.5% |
| Immigrants | Colombia | 0.5 /100 | #257 | Tragic 97.5% |
| Yaqui | 0.5 /100 | #258 | Tragic 97.5% |
| Fijians | 0.5 /100 | #259 | Tragic 97.5% |
| Assyrians/Chaldeans/Syriacs | 0.5 /100 | #260 | Tragic 97.5% |
Demographics Similar to Guatemalans by 2nd Grade
In terms of 2nd grade, the demographic groups most similar to Guatemalans are Immigrants from Cabo Verde (96.3%, a difference of 0.030%), Immigrants from Cambodia (96.4%, a difference of 0.050%), Immigrants from Fiji (96.4%, a difference of 0.060%), Yakama (96.4%, a difference of 0.070%), and Central American (96.4%, a difference of 0.080%).
| Demographics | Rating | Rank | 2nd Grade |
| Bangladeshis | 0.0 /100 | #332 | Tragic 96.5% |
| Immigrants | Dominican Republic | 0.0 /100 | #333 | Tragic 96.4% |
| Central Americans | 0.0 /100 | #334 | Tragic 96.4% |
| Yakama | 0.0 /100 | #335 | Tragic 96.4% |
| Immigrants | Fiji | 0.0 /100 | #336 | Tragic 96.4% |
| Immigrants | Cambodia | 0.0 /100 | #337 | Tragic 96.4% |
| Immigrants | Cabo Verde | 0.0 /100 | #338 | Tragic 96.3% |
| Guatemalans | 0.0 /100 | #339 | Tragic 96.3% |
| Immigrants | Guatemala | 0.0 /100 | #340 | Tragic 96.2% |
| Immigrants | Central America | 0.0 /100 | #341 | Tragic 96.2% |
| Immigrants | Mexico | 0.0 /100 | #342 | Tragic 96.1% |
| Nepalese | 0.0 /100 | #343 | Tragic 96.1% |
| Salvadorans | 0.0 /100 | #344 | Tragic 96.0% |
| Immigrants | El Salvador | 0.0 /100 | #345 | Tragic 95.9% |
| Immigrants | Yemen | 0.0 /100 | #346 | Tragic 95.7% |